MENU
Skip menuPlots
Here we collected the plots describing the analyzed workload that are not shown in the article. Some plots are shown here, because, though depicting interesting information, they are of lesser importance for our research and do not need to be present in the article. Some plots are relevant, but we could not place them in the article due to the lack of space. Some plots are variations of the plots that are shown in the article, for example, histograms or line plots instead of survival or distibution function.High level statistics
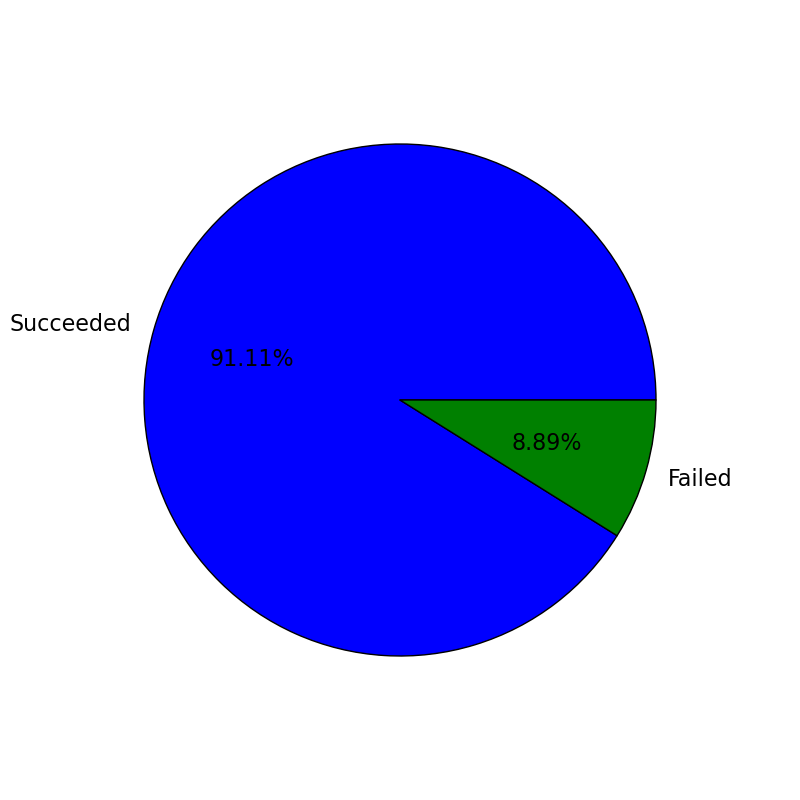
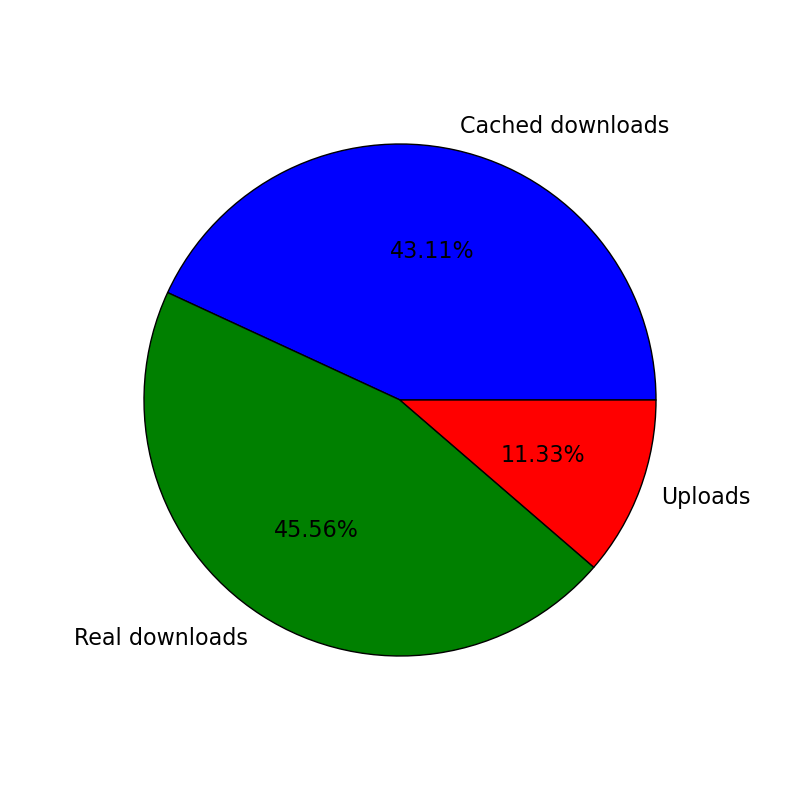
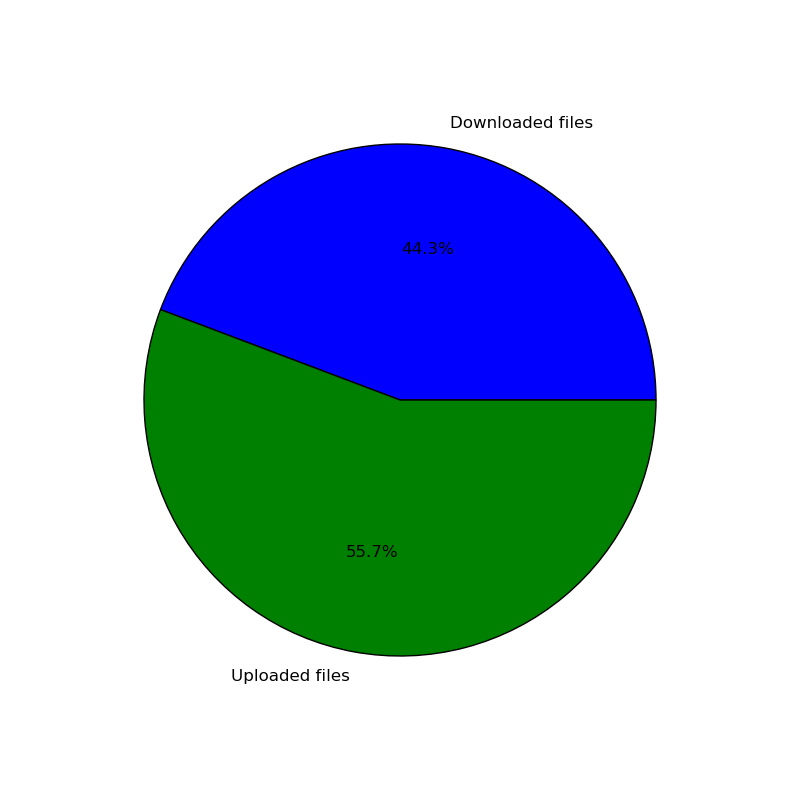
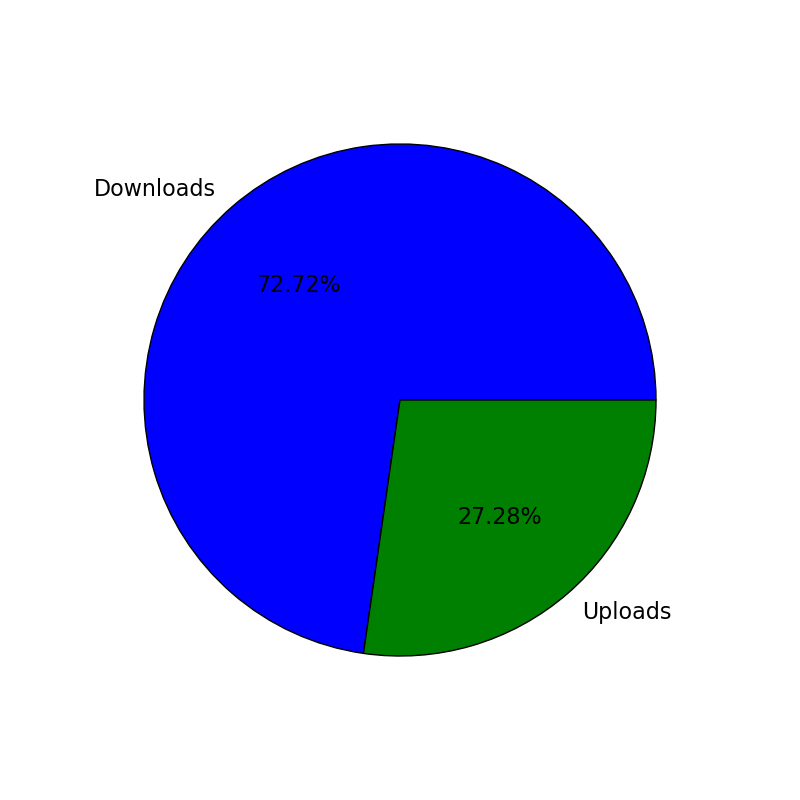
These pie chart illustrate general information about the workload by showing the ratios between its main parameters.
- Succeeded/failed jobs
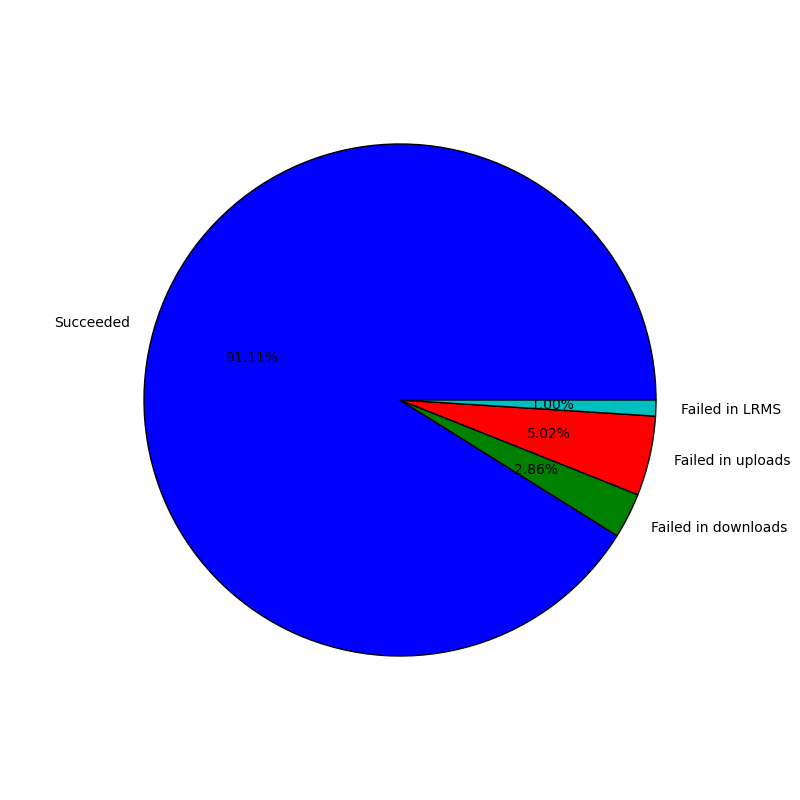
- Succeeded/failed with (possible) stage of failure specifications. The specifications of stage when the failure occured is based on guesses. There is no clear registration of failure reason, so we perform the assessment of the job parameters like exit code, running time and others and try to guess if the job was in download, LRMS or upload stage when it failed. Though this method is to some extent credible and the given values are confirmed with what the ATLAS administrators usually see in their accounting system, we can not in any case claim that the numbers are 100% true.
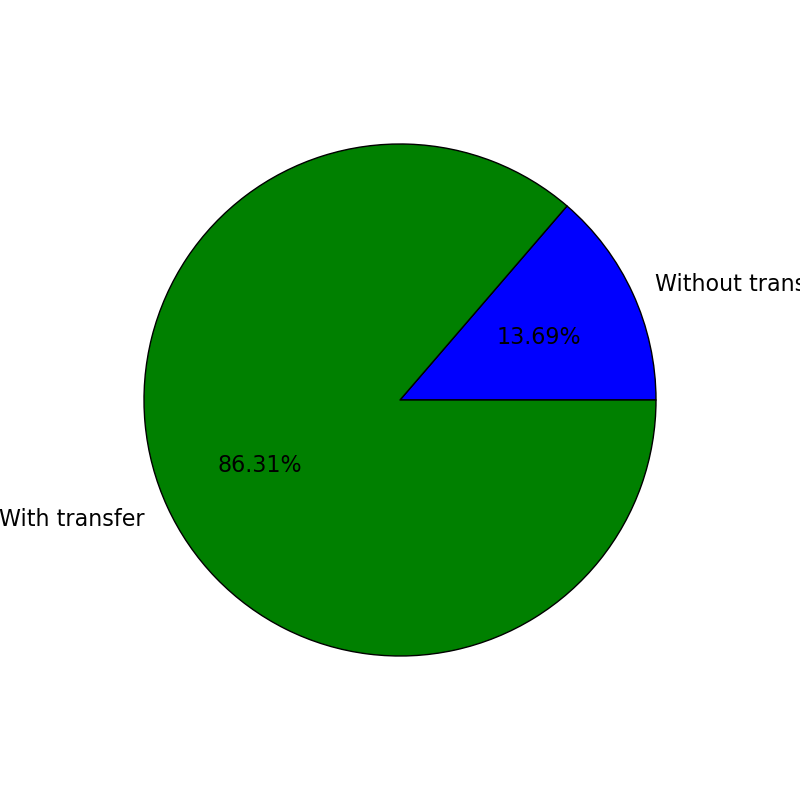
- Succeeded jobs with/without performed transfer
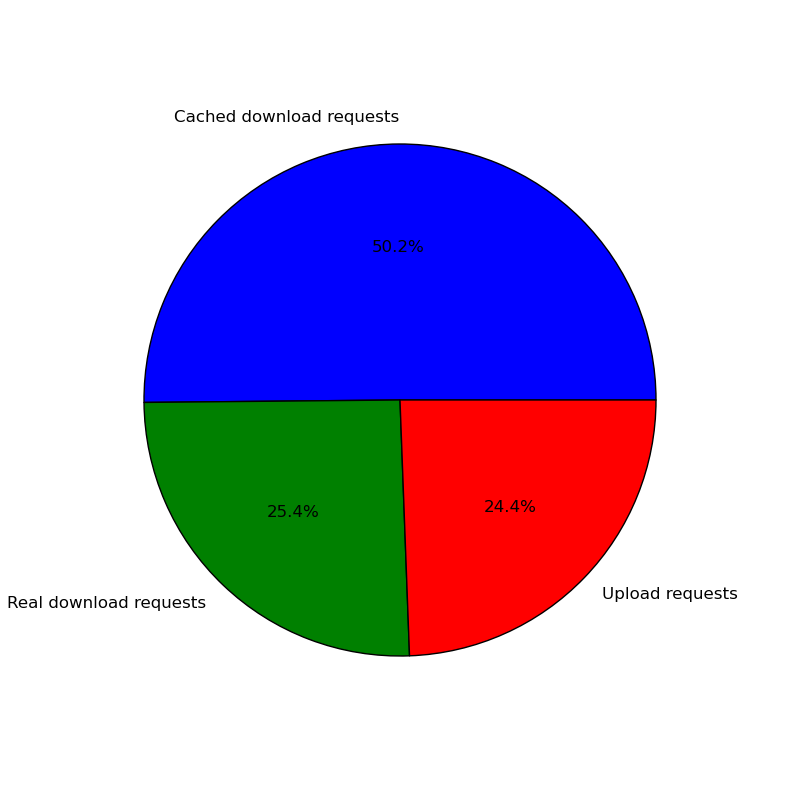
- Transfer requests from succeeded jobs: cached inputs, not cached inputs, outputs
- Amount of data, that is held in: cached inputs, not cached inputs, outputs
- Number of unique input and output files
- Size of unique input and output files
Distributions
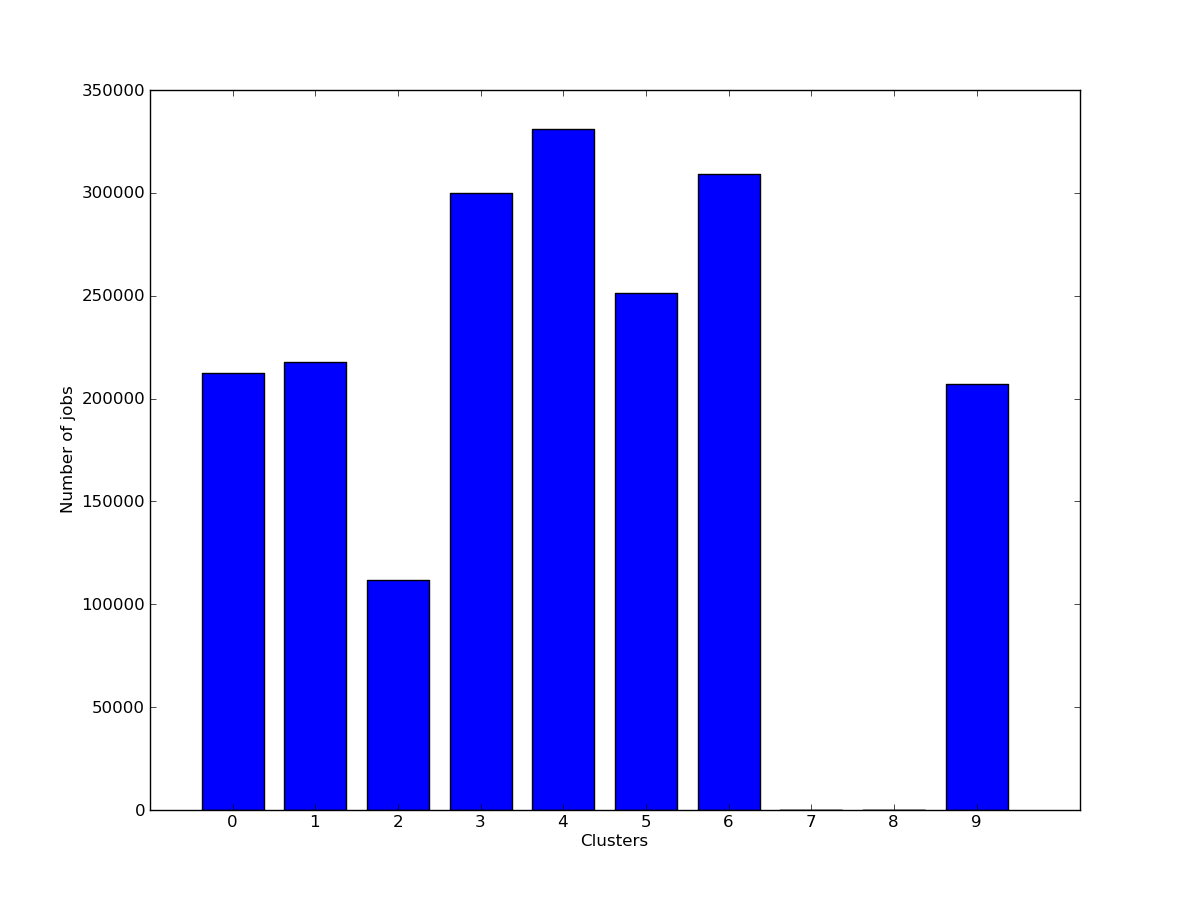
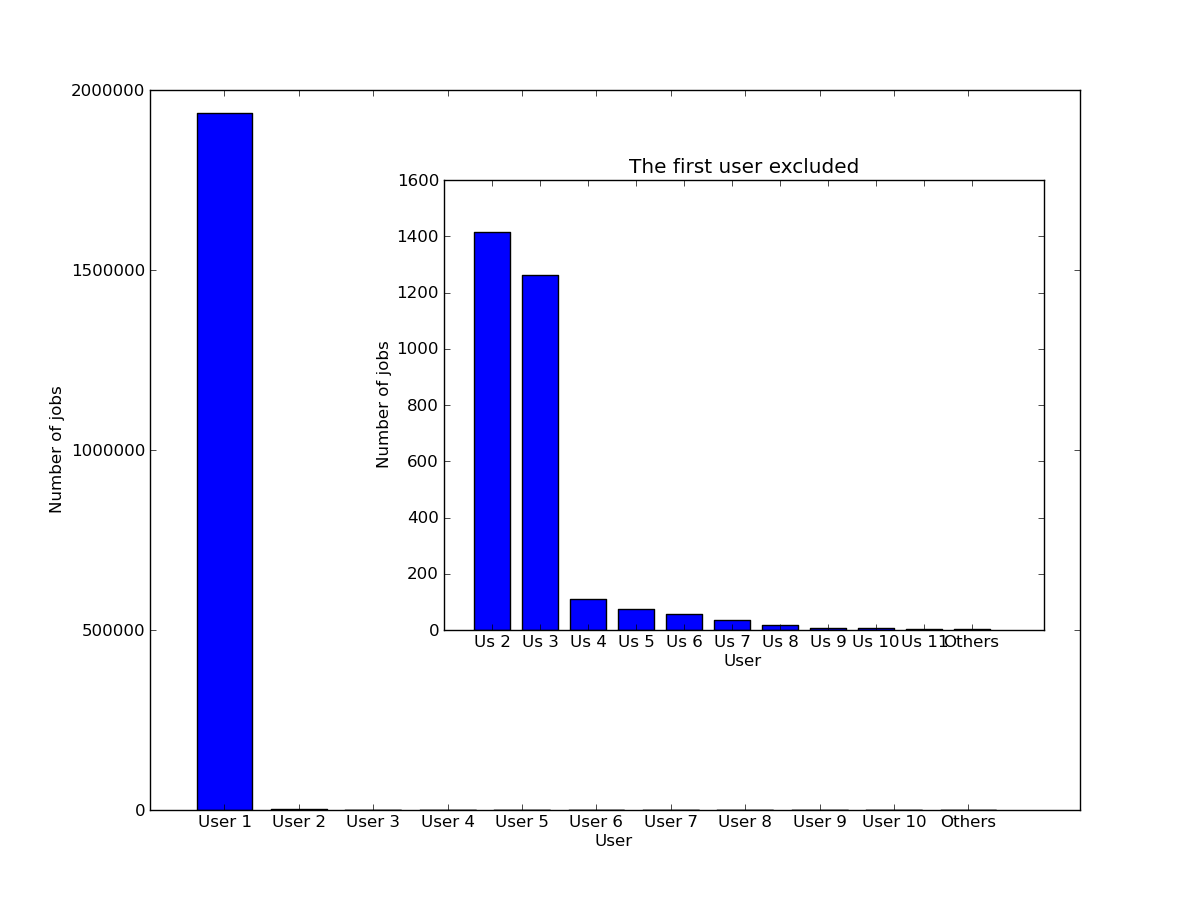
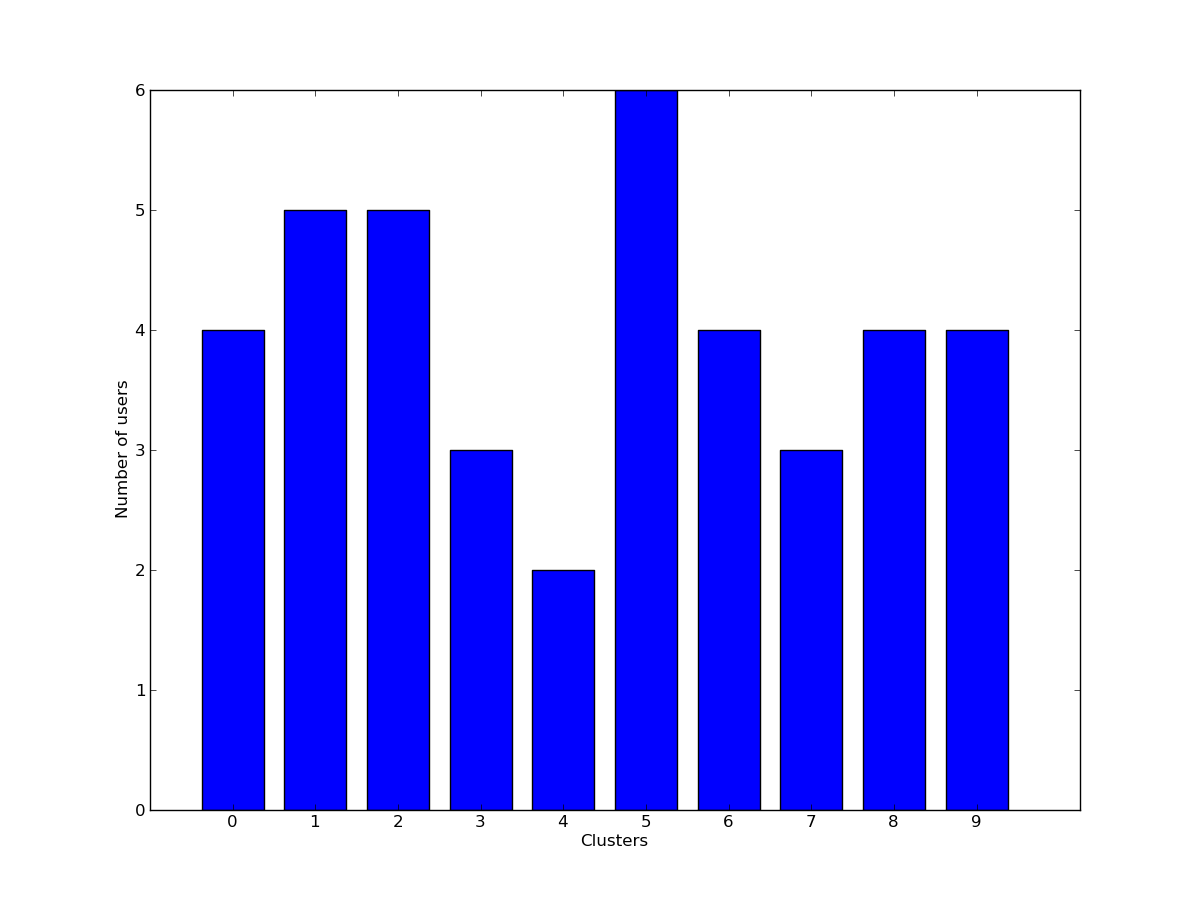
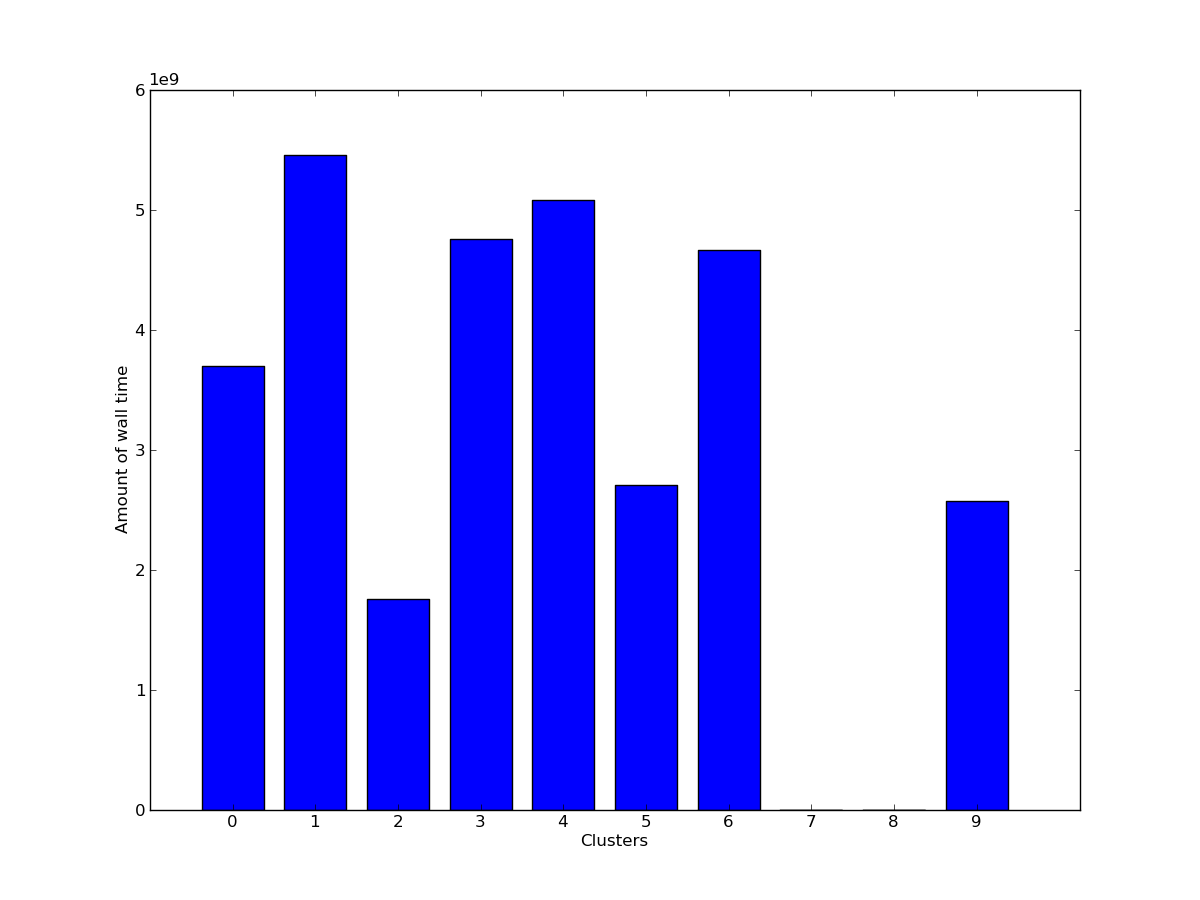
These bar charts illustrate how different parameters are distributed among particular objects. The objects do not change their order on different plots, i.e. a cluster marked 1 on some plot is always cluster 1 on all the other plots.
- Successful jobs across clusters
- Successful jobs across users
- Users across clusters
- Walltime of successful jobs across clusters
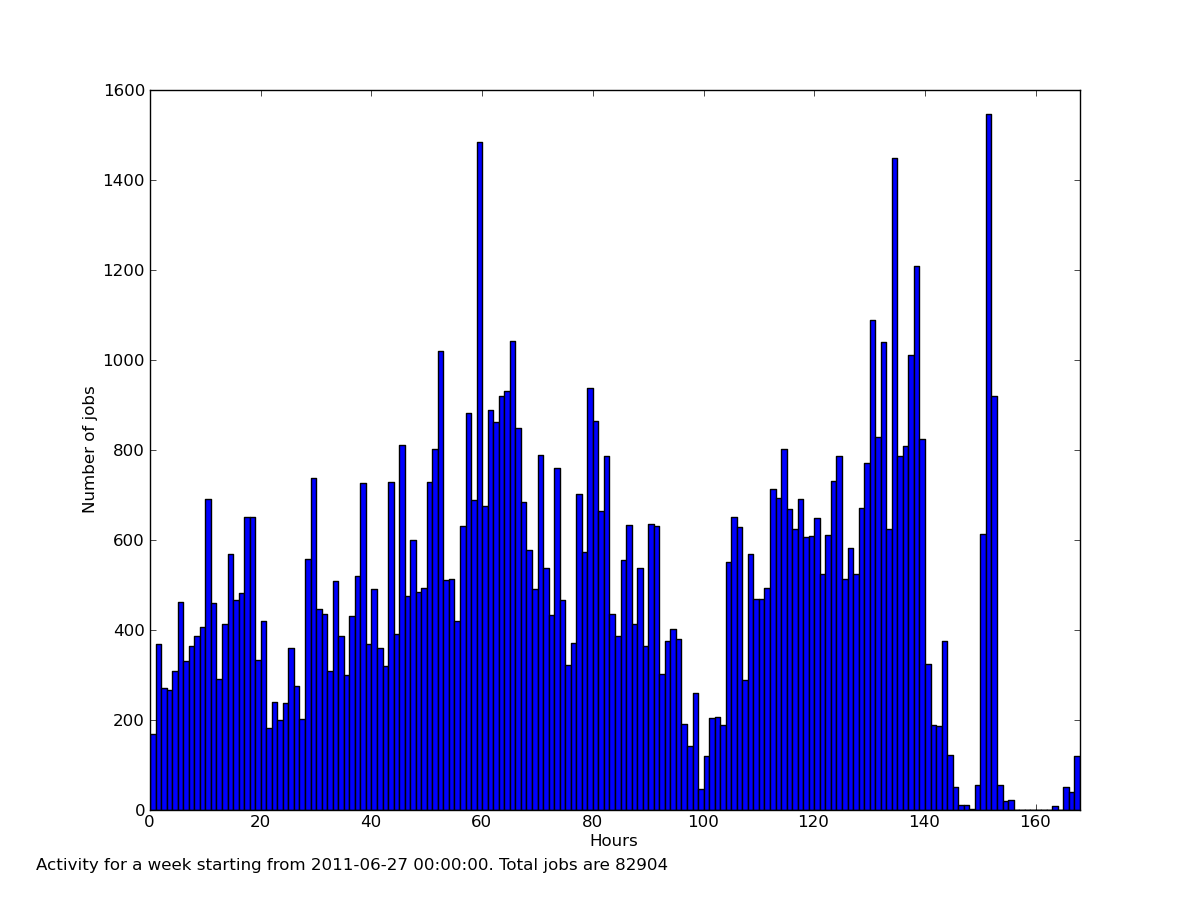
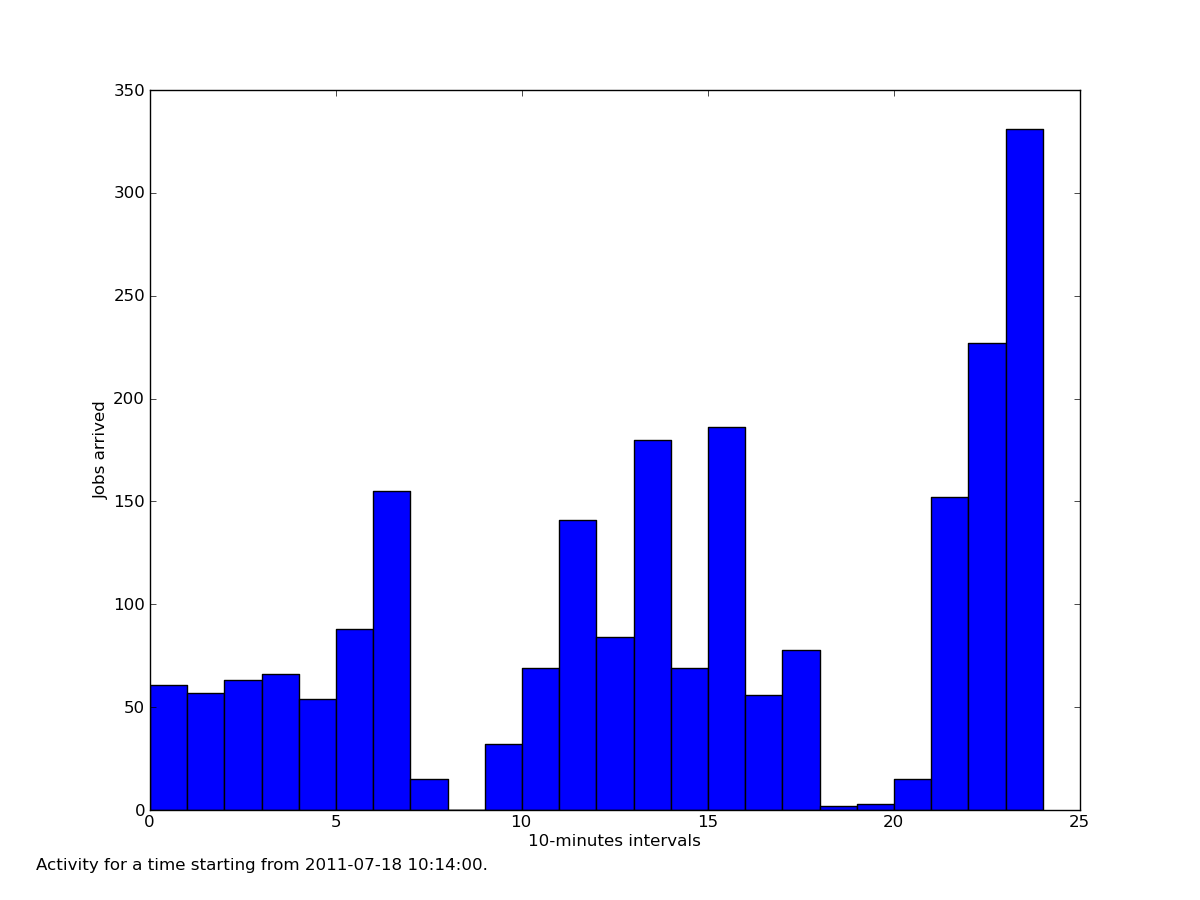
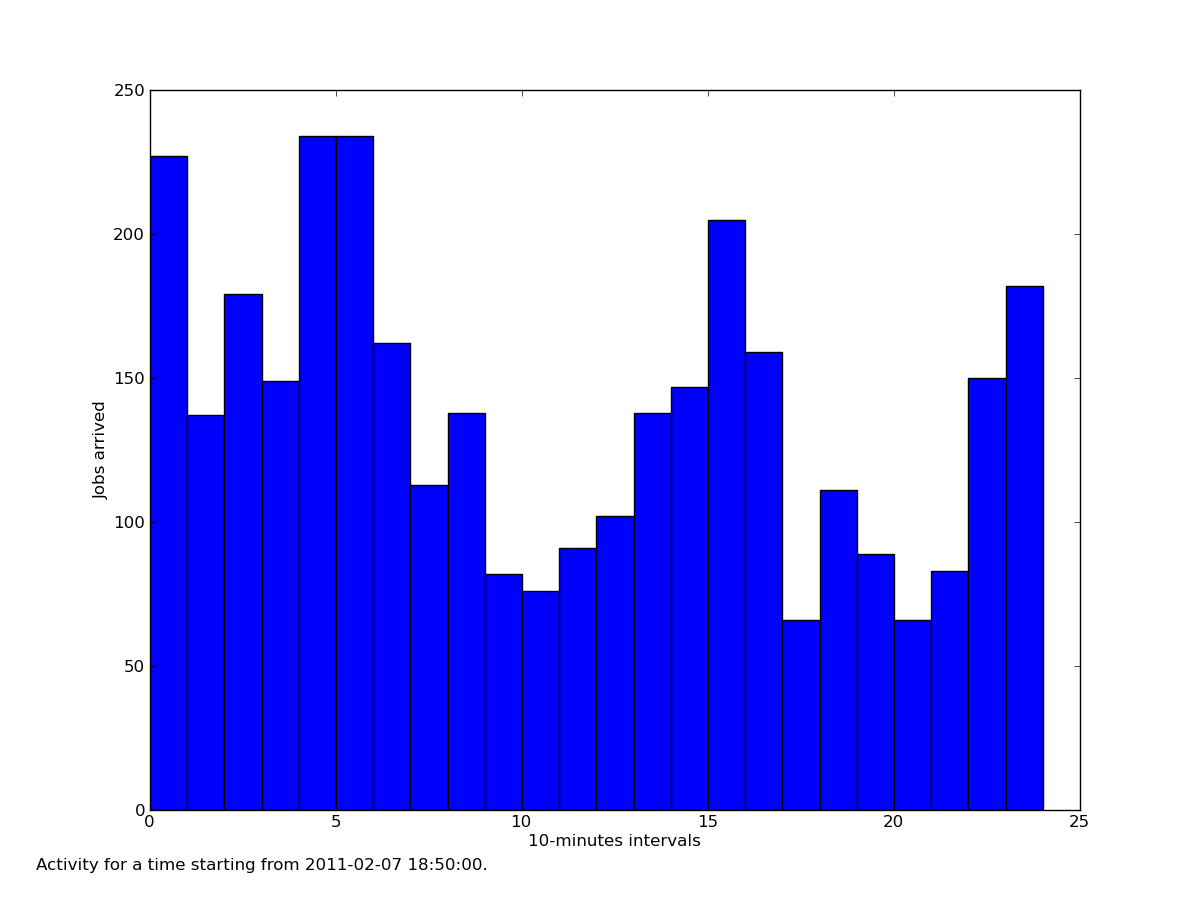
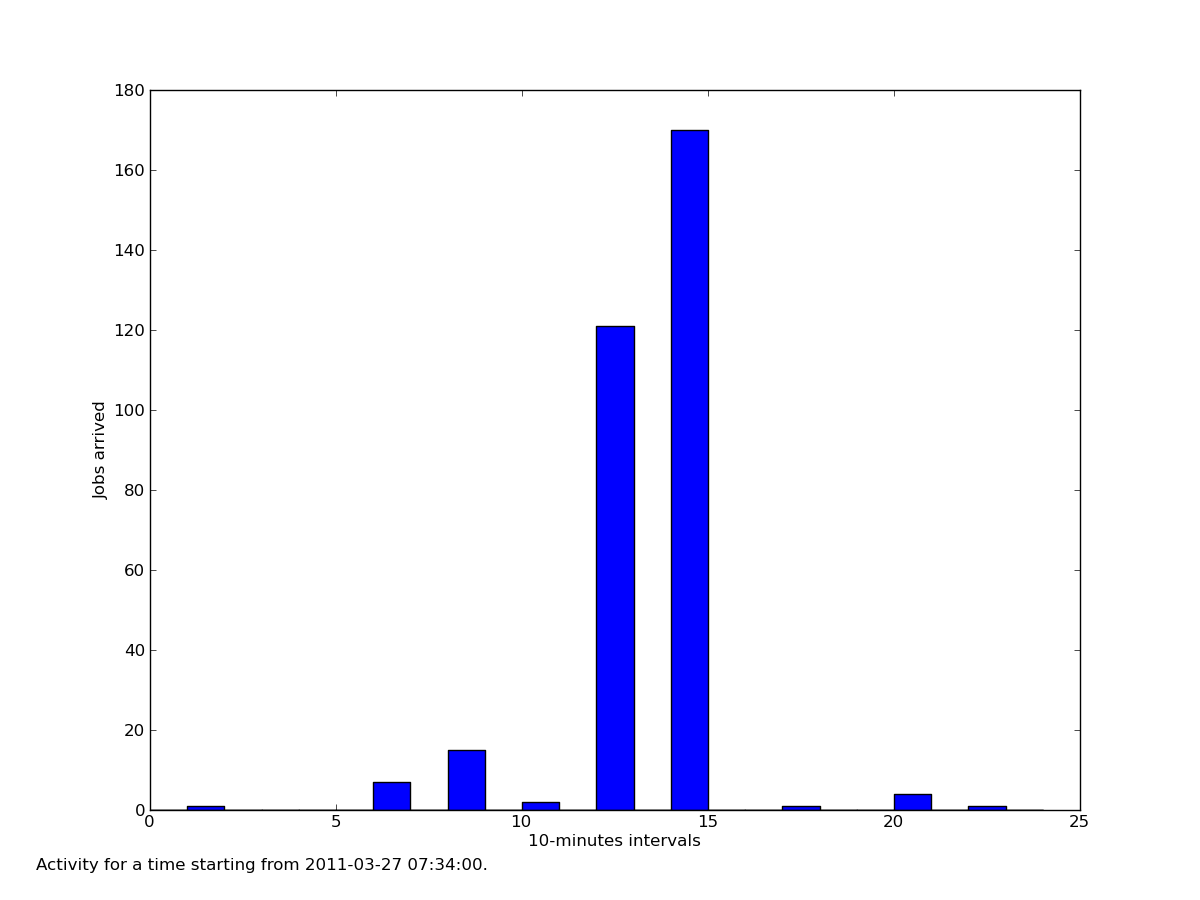
Temporal statistics
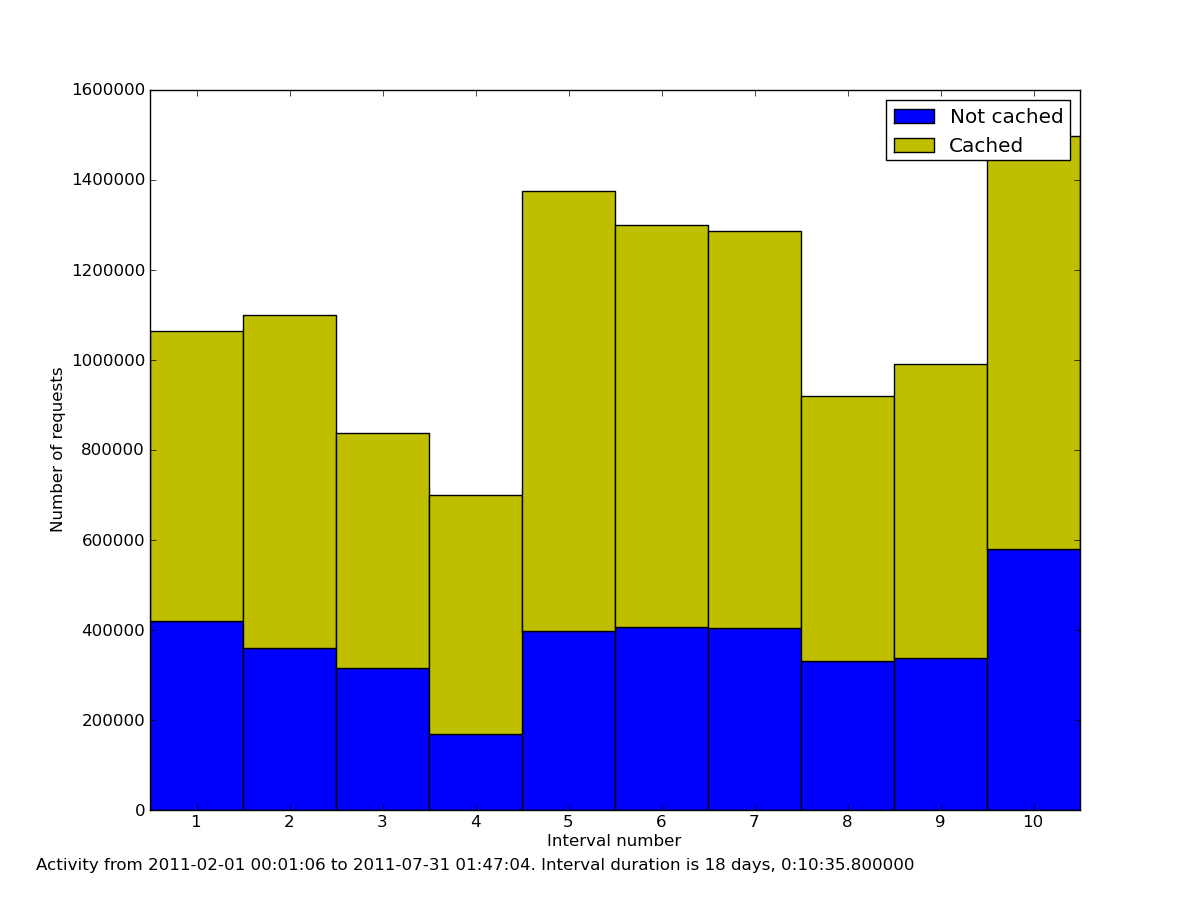
These plots illustrate how different parameters change over time.
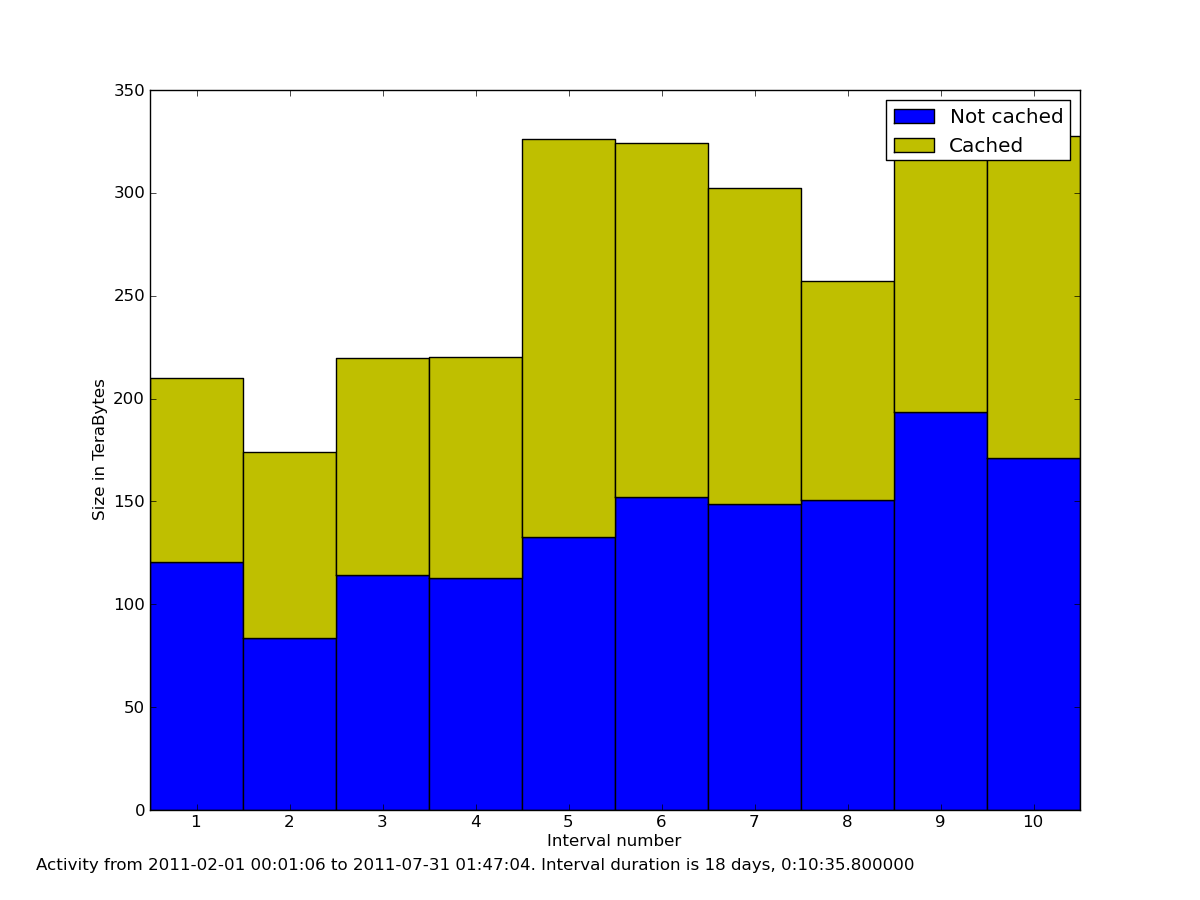
- Cache hit/miss by requests over time
- Cache hit/miss by size over time
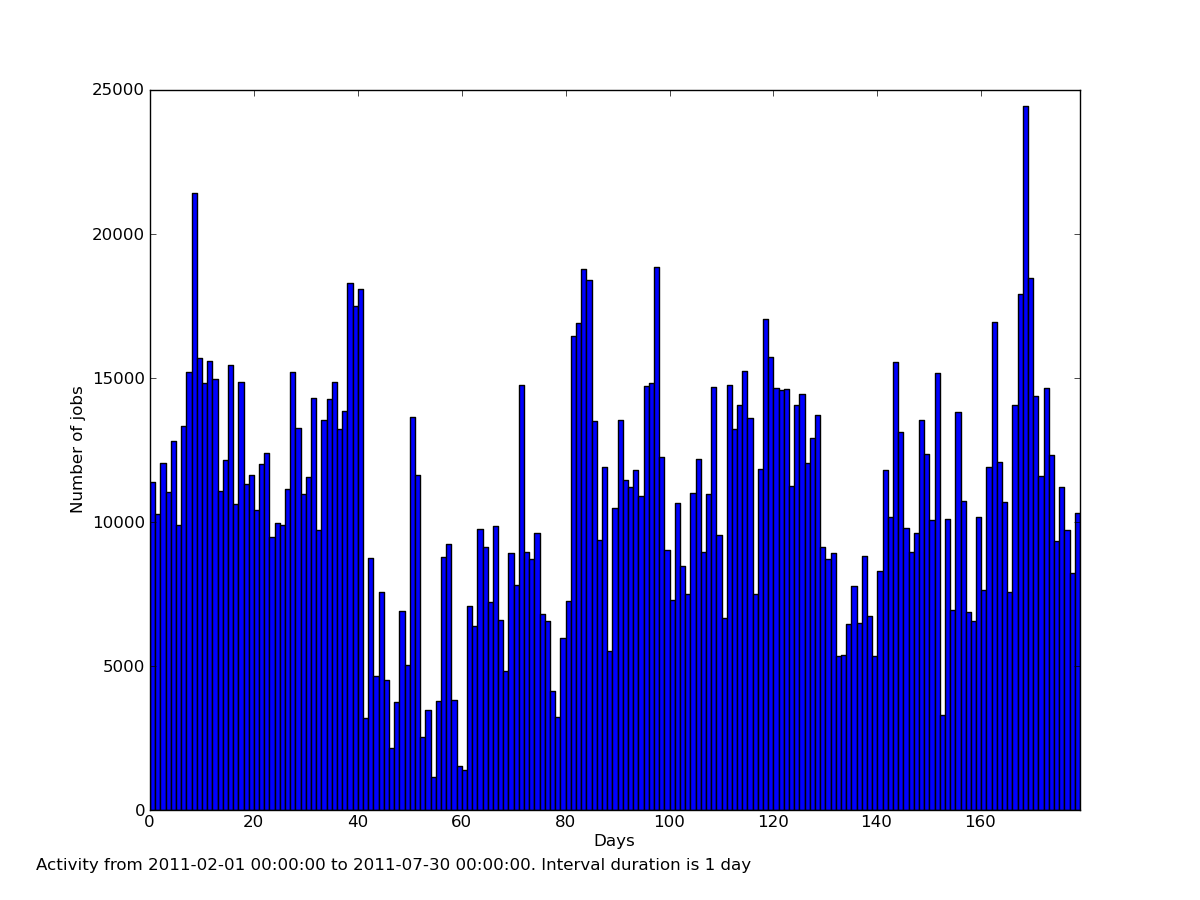
- Jobs arrival rate by days
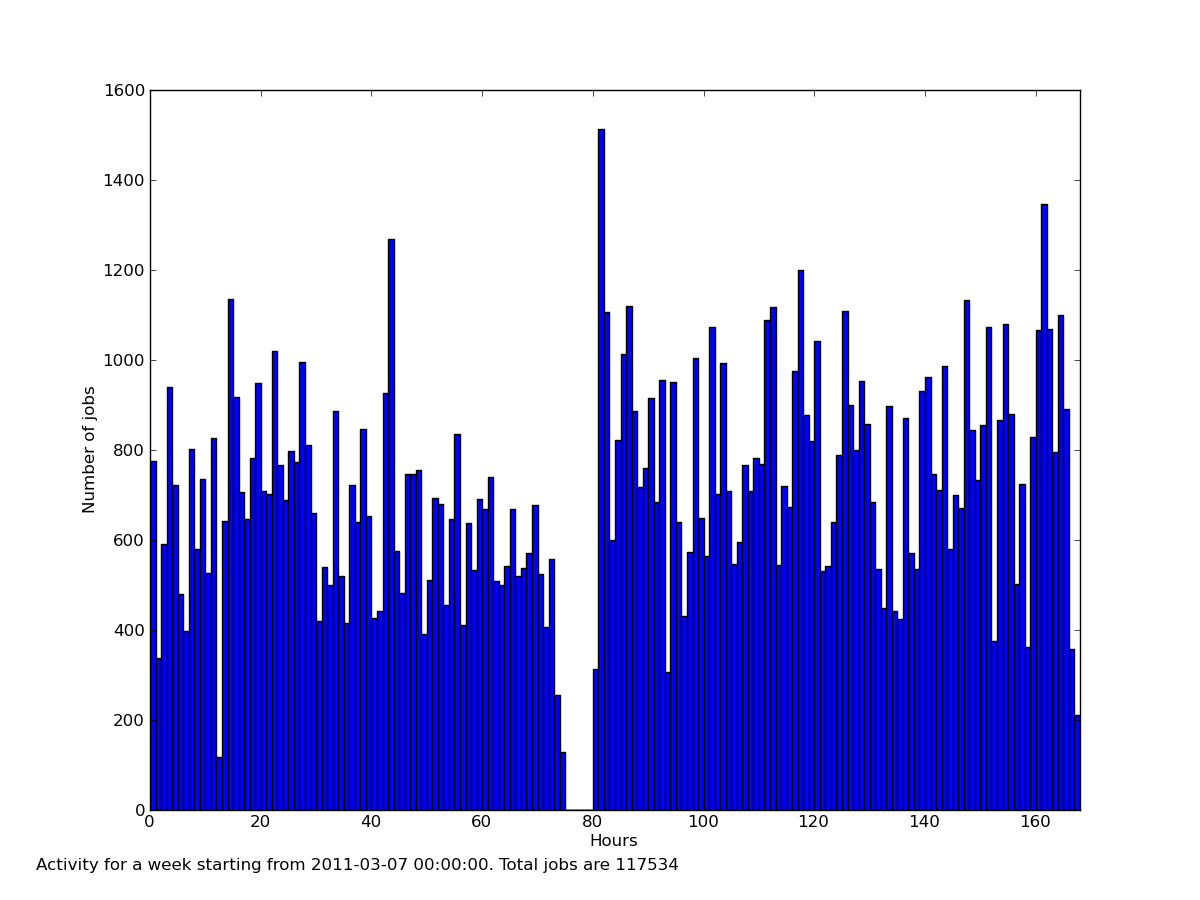
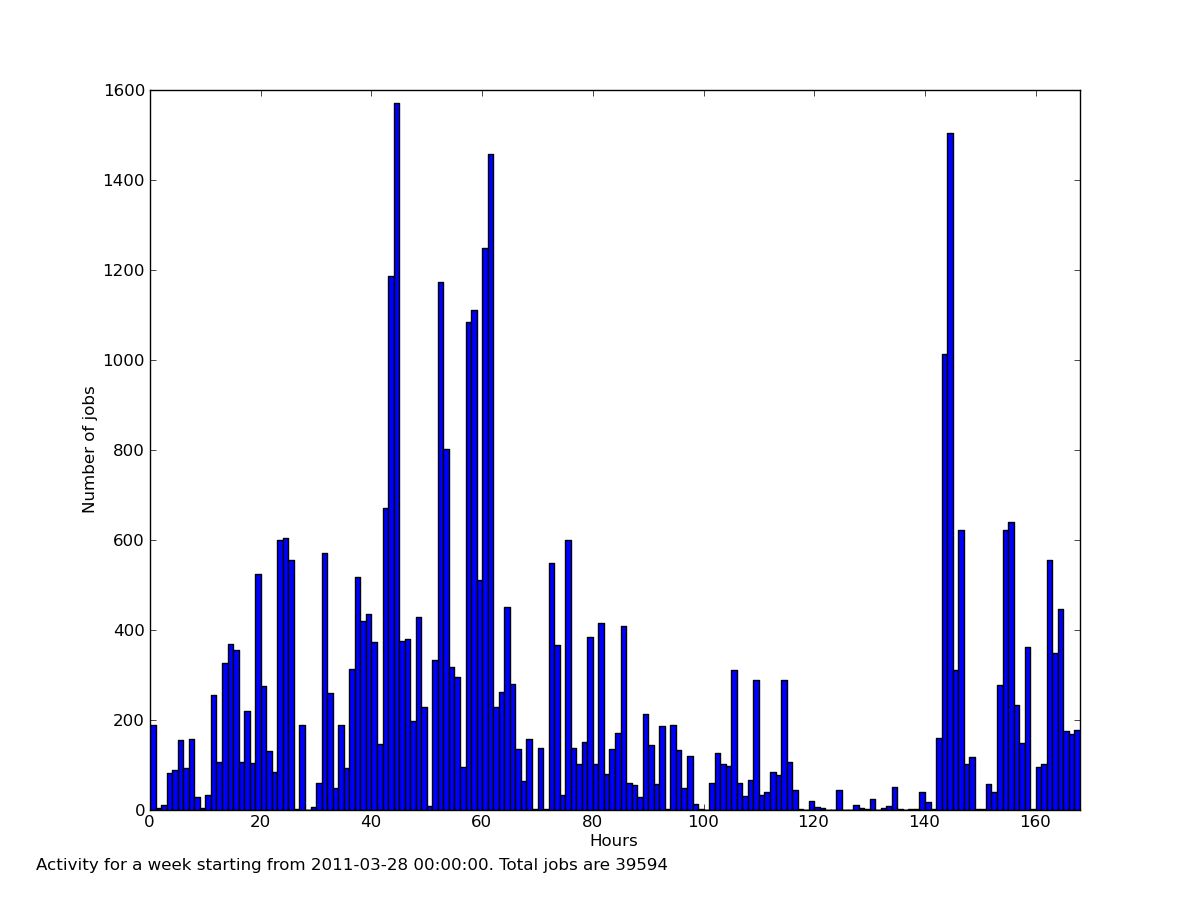
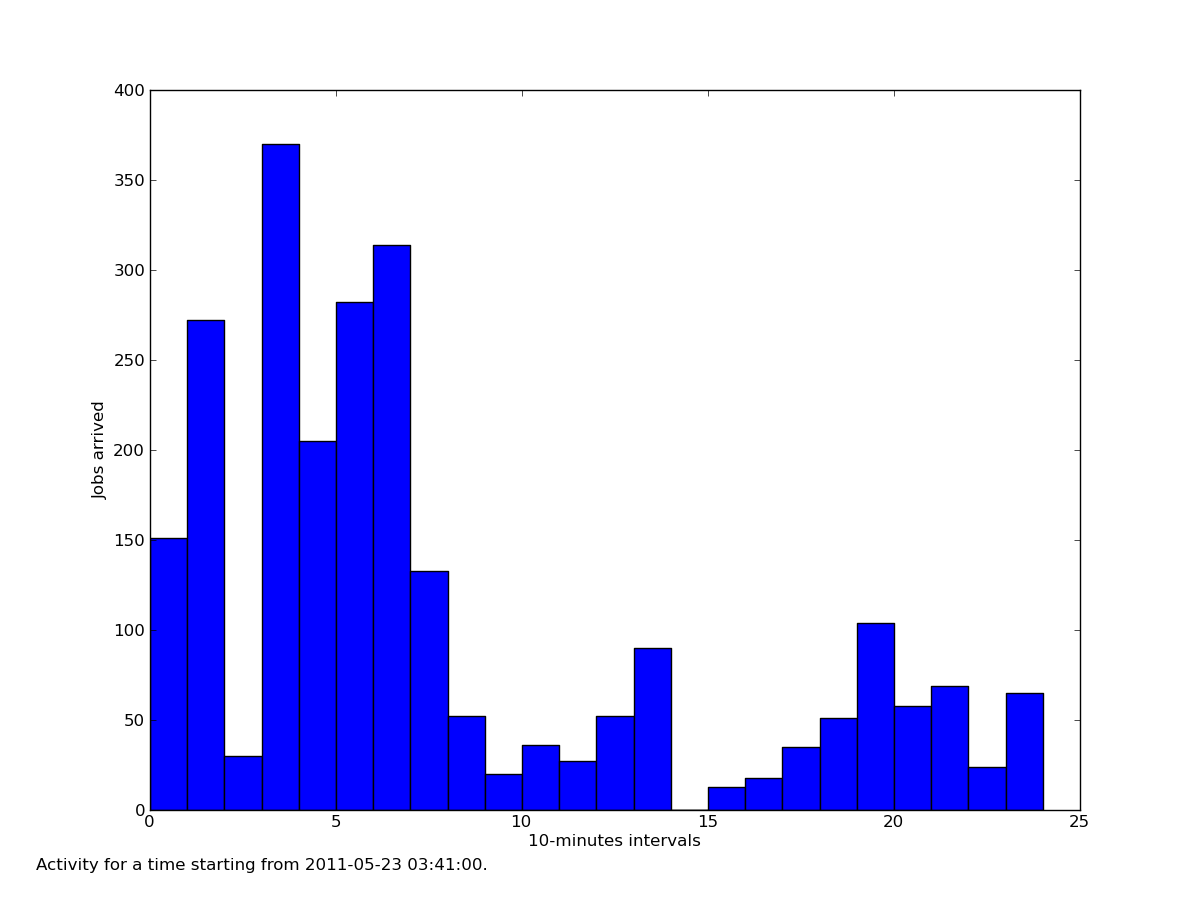
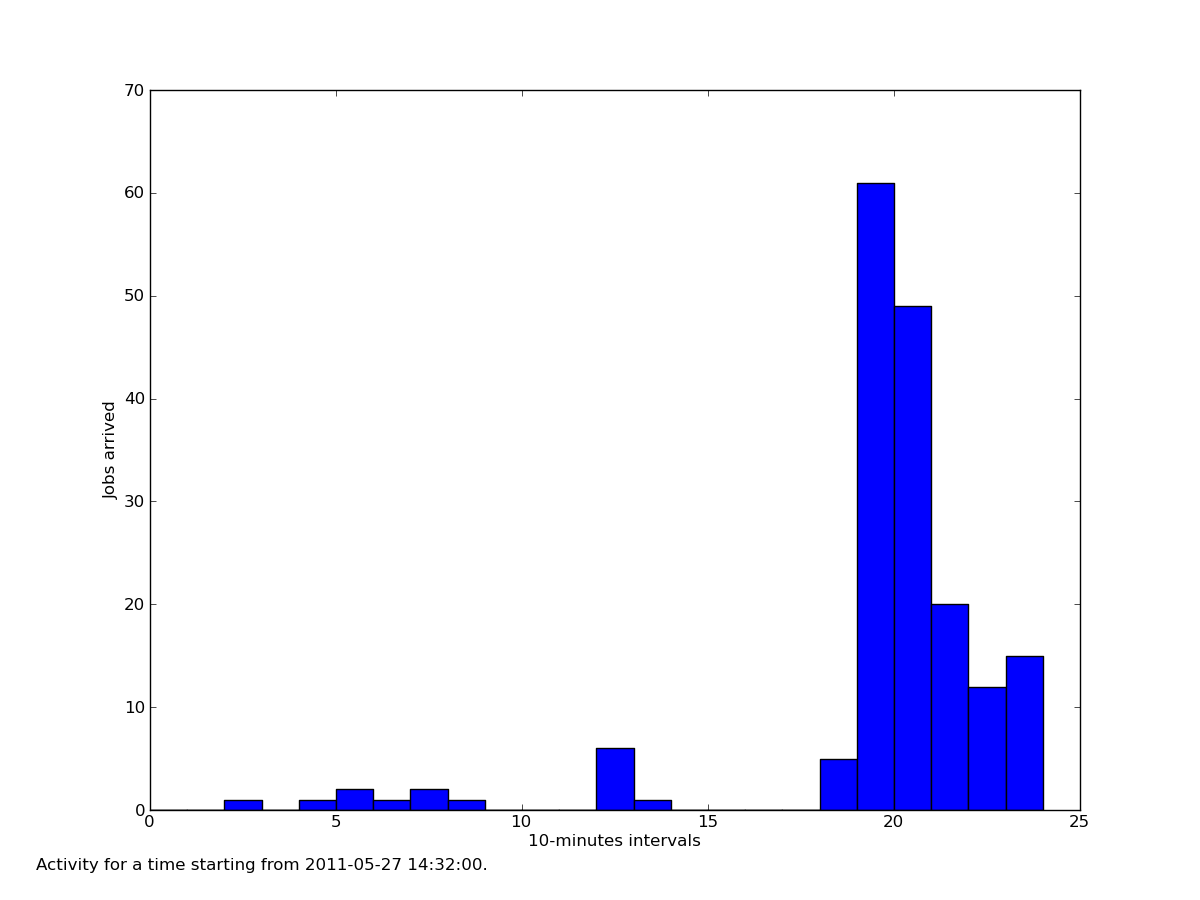
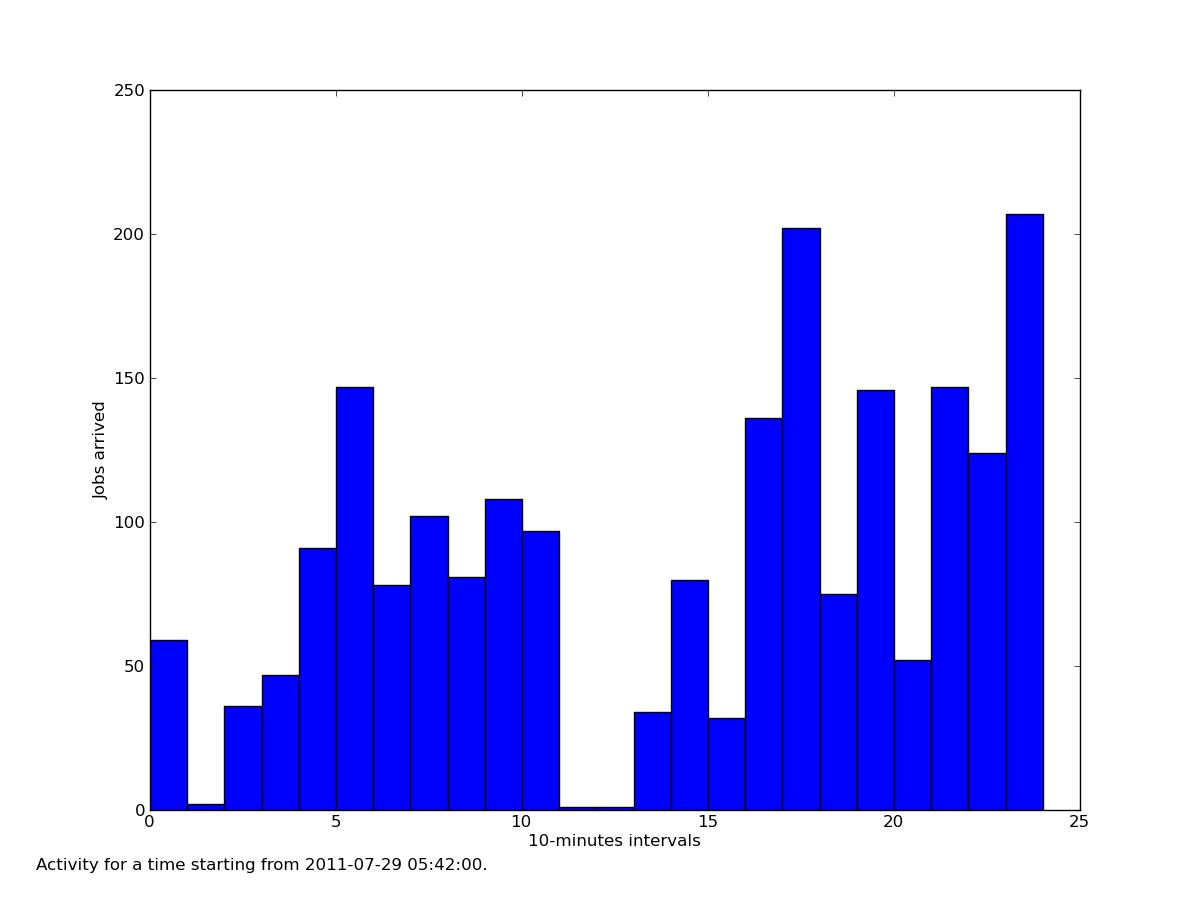
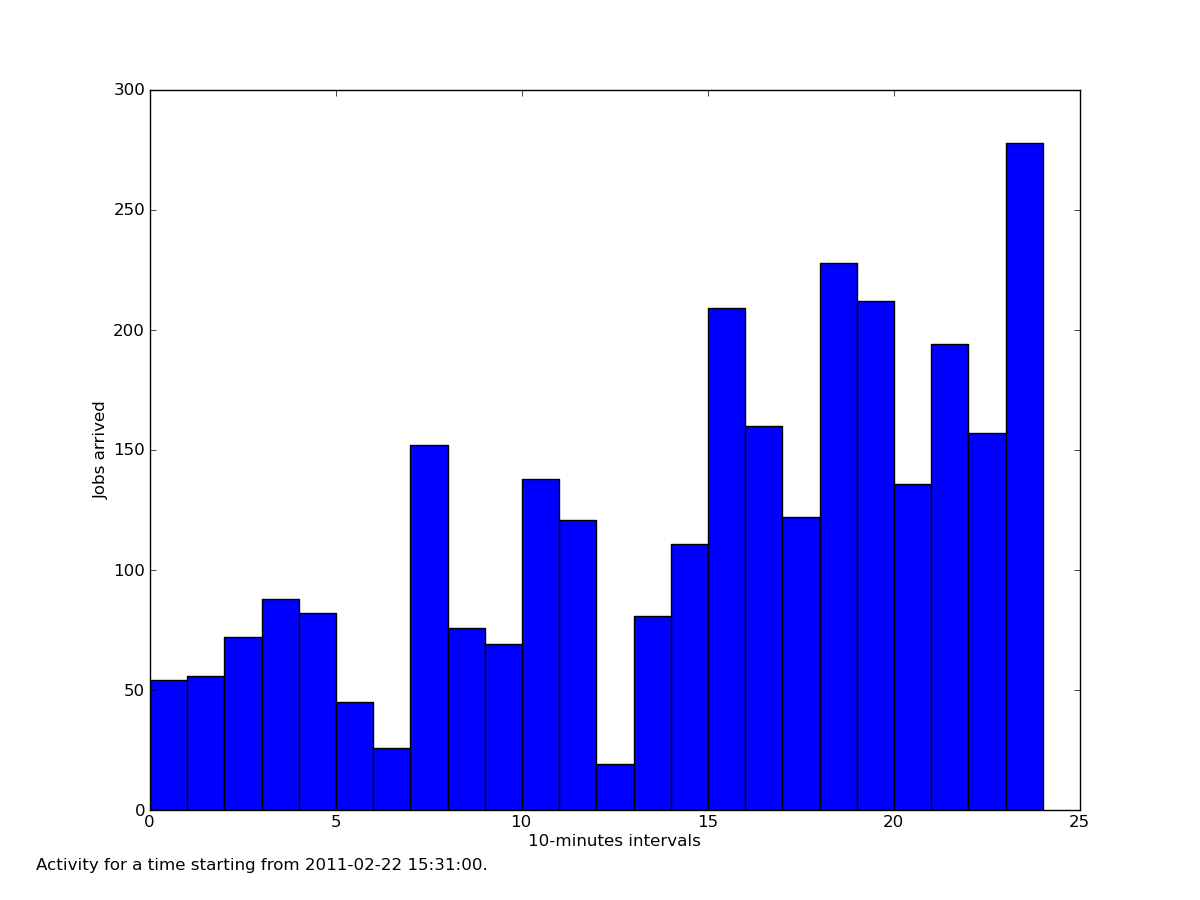
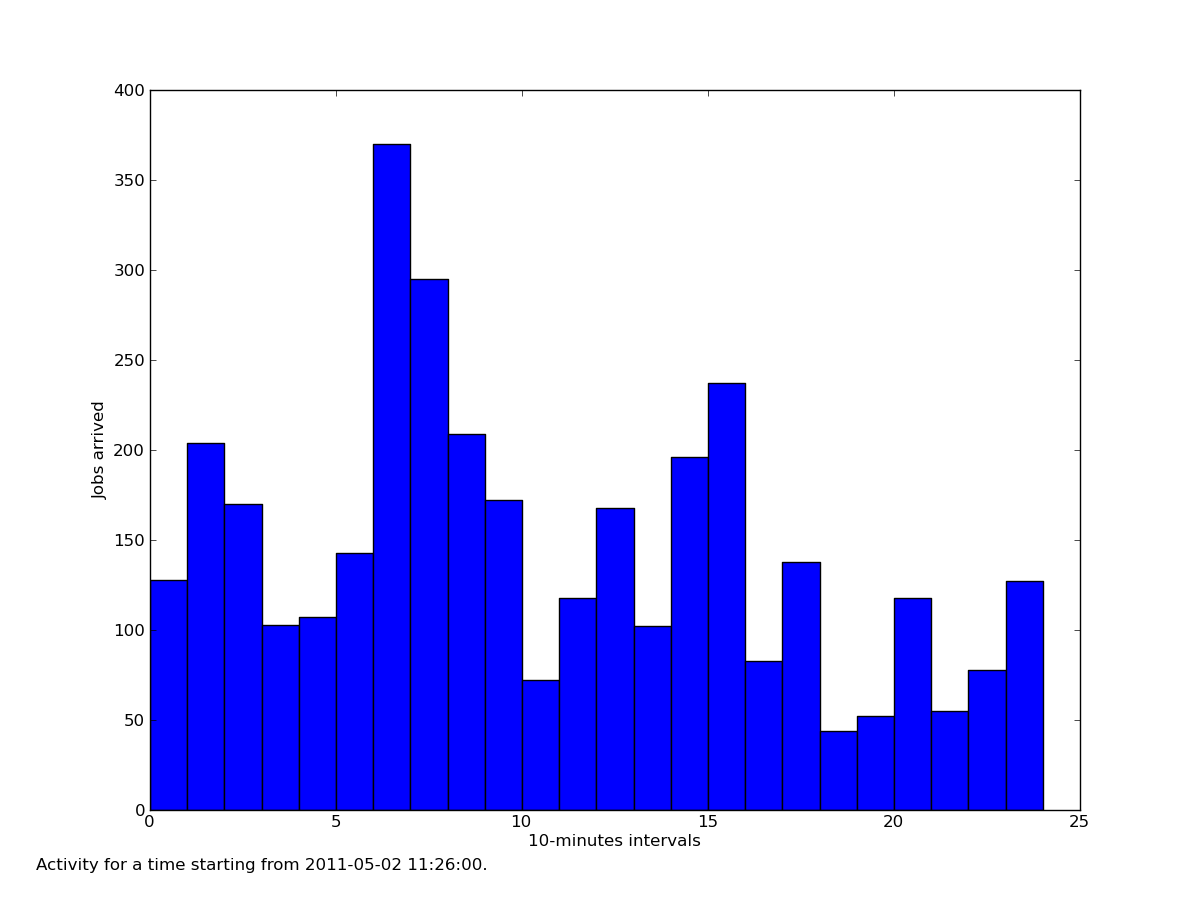
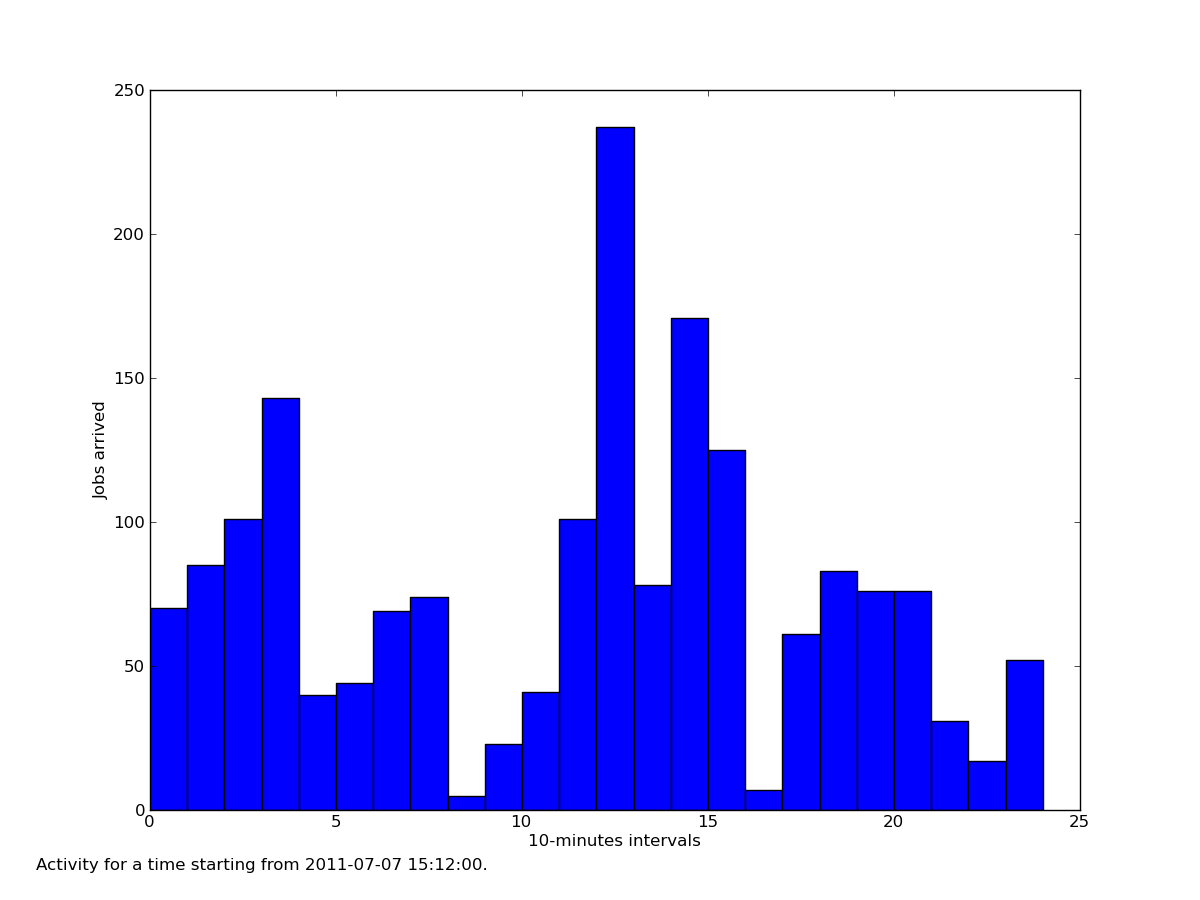
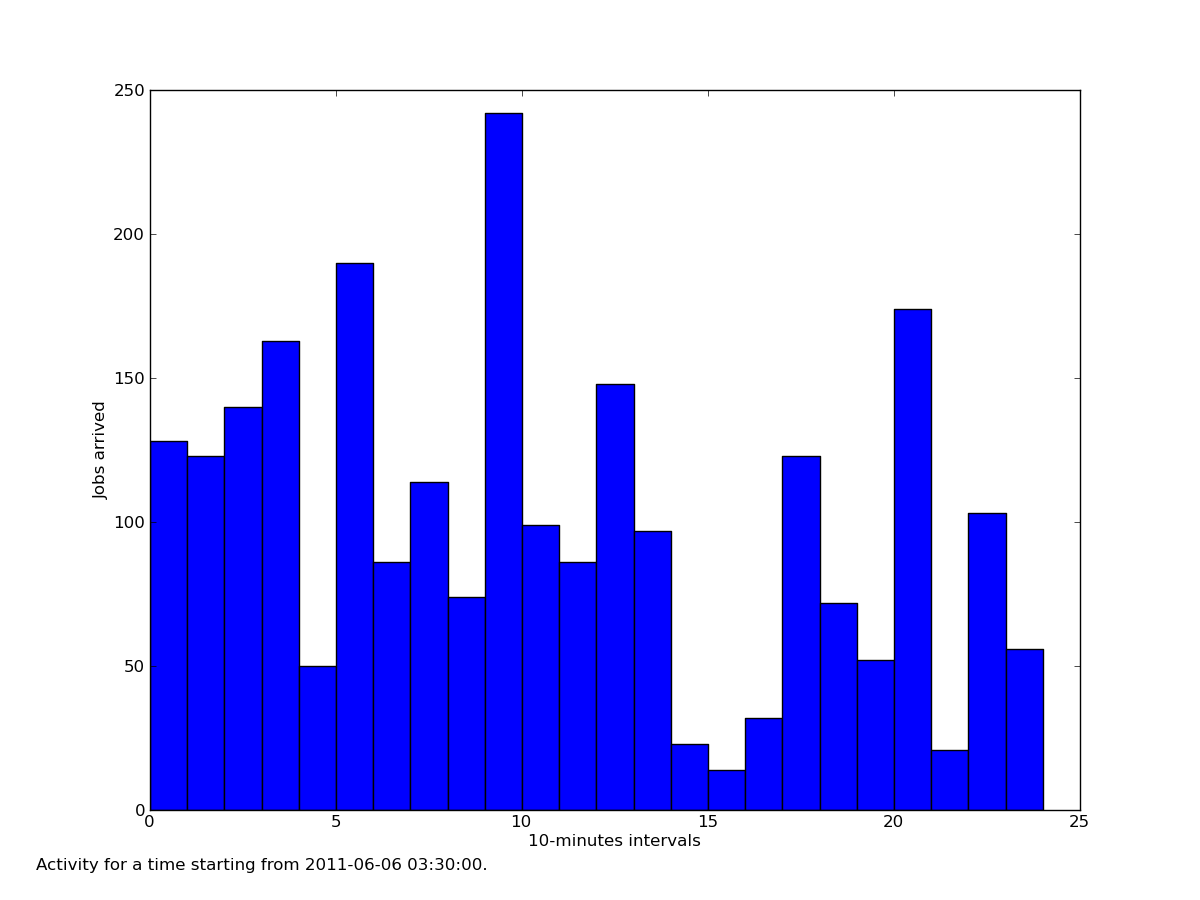
- Jobs arrival rate by hours for: the week with most jobs; the week with least jobs; the week with average amount of jobs. Average means that we picked up a week with value of jobs closest to arithmetical mean of numbers of jobs per week.
- Jobs arrival rate by 10 minutes intervals for 10 random 4-hour intervals: 1; 2; 3; 4; 5; 6; 7; 8; 9; 10.
Proof of sample representativeness
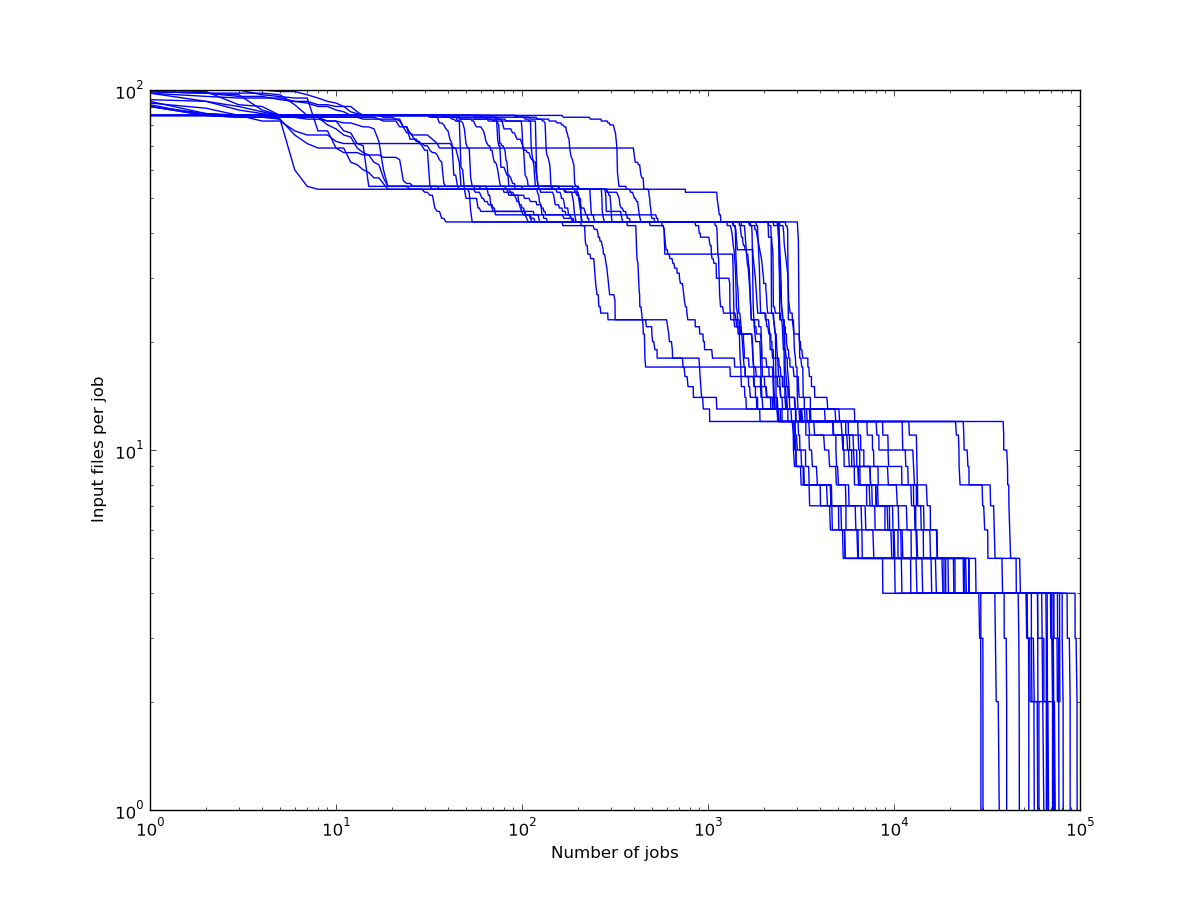
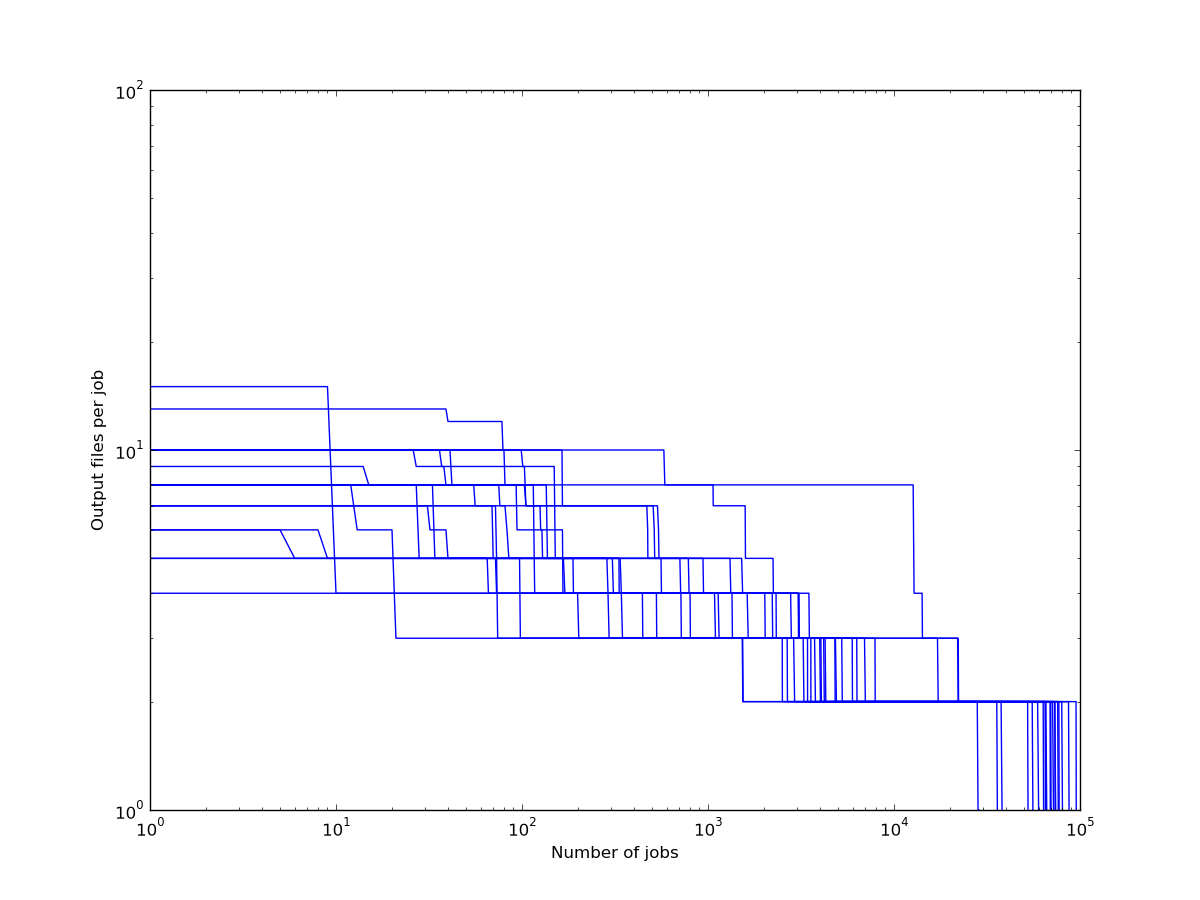
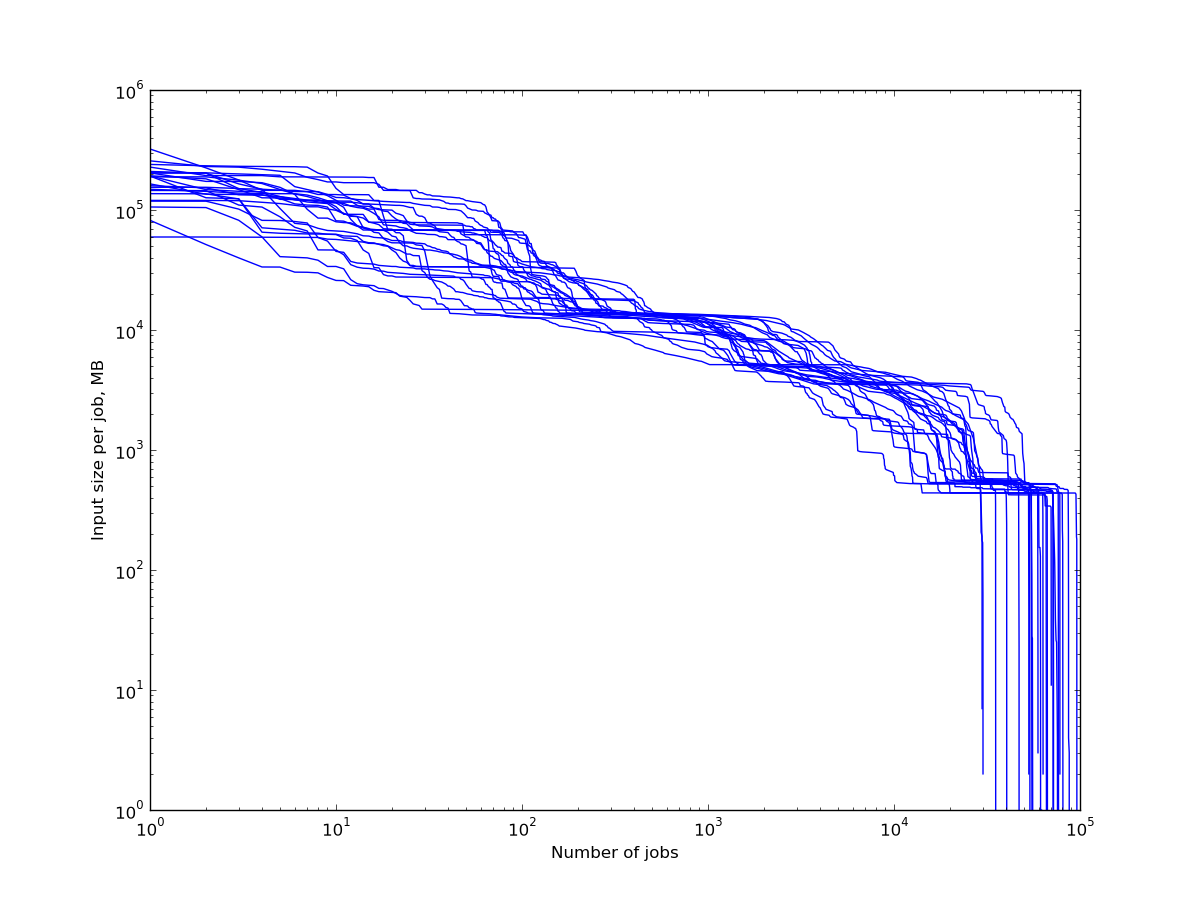
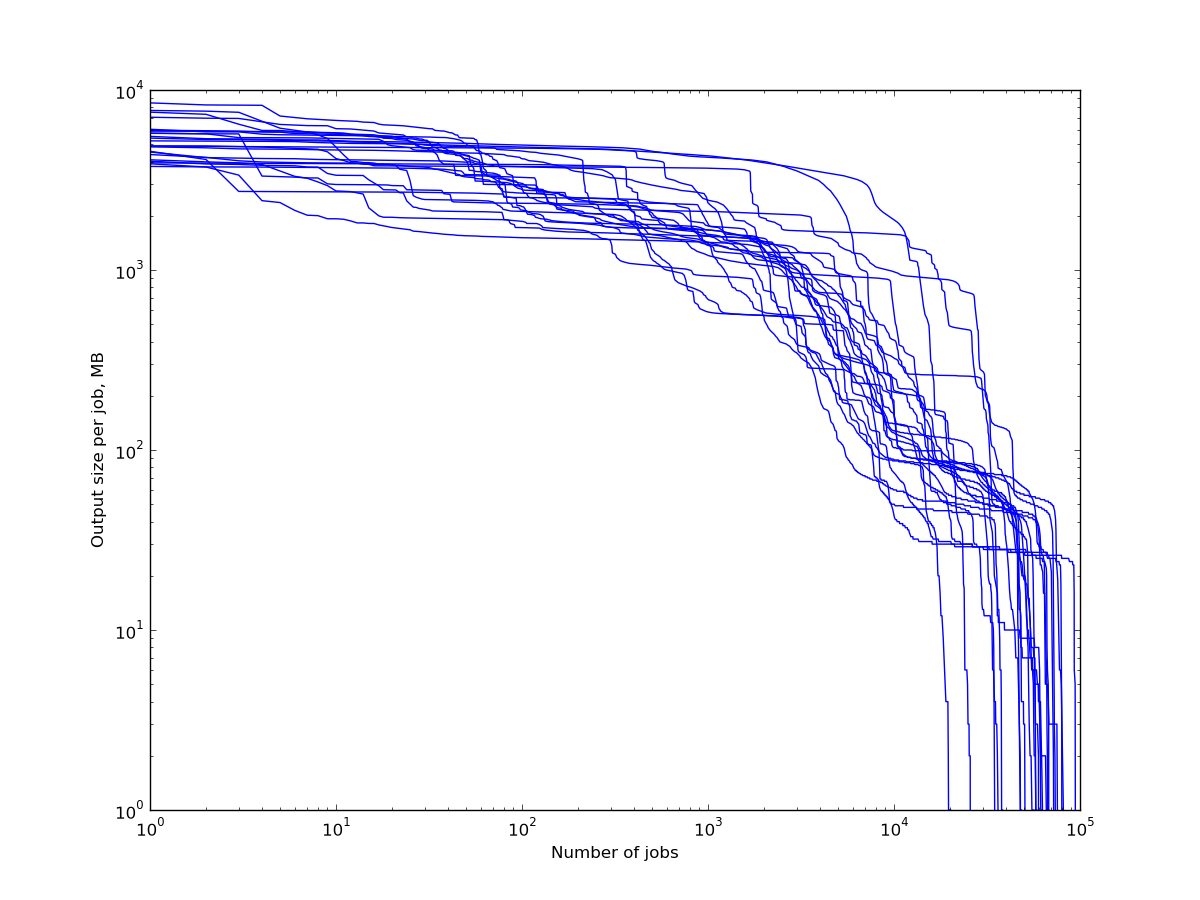
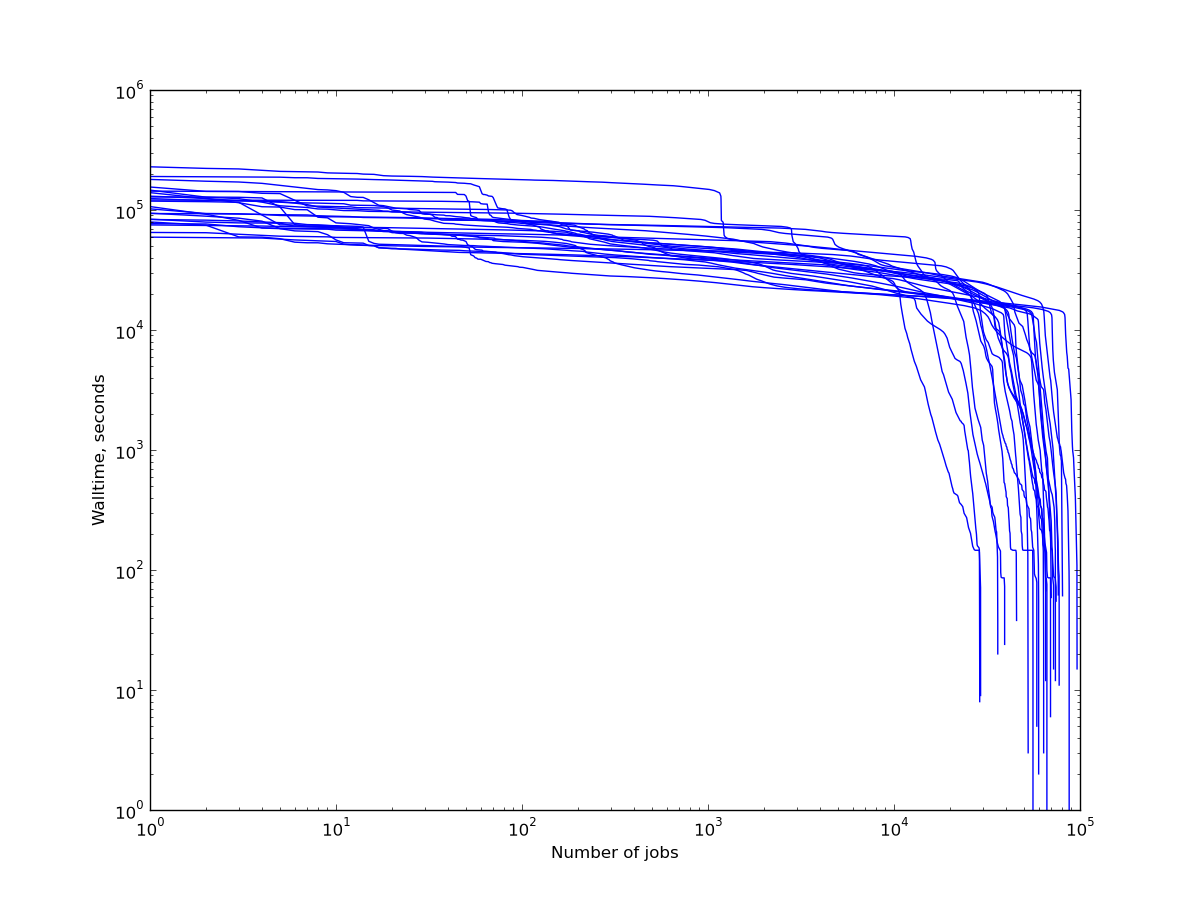
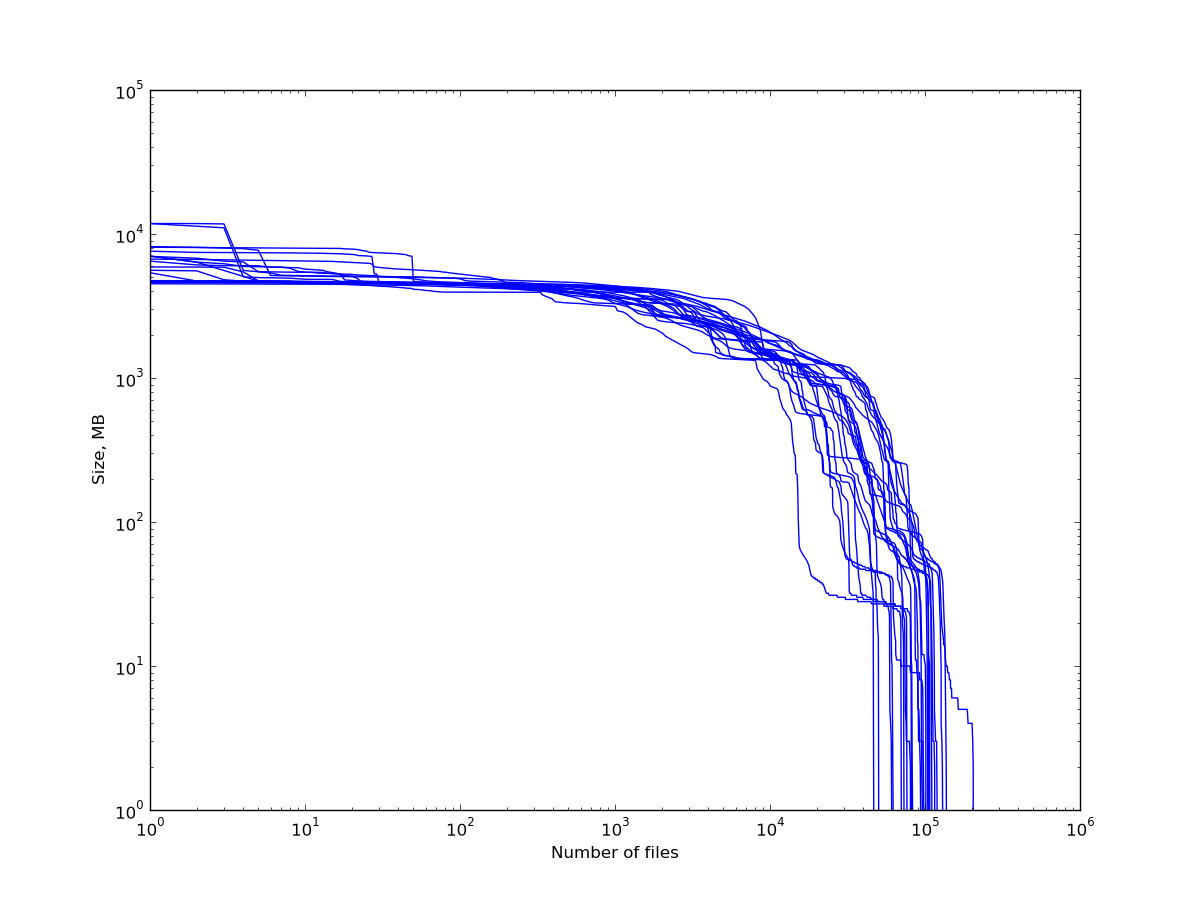
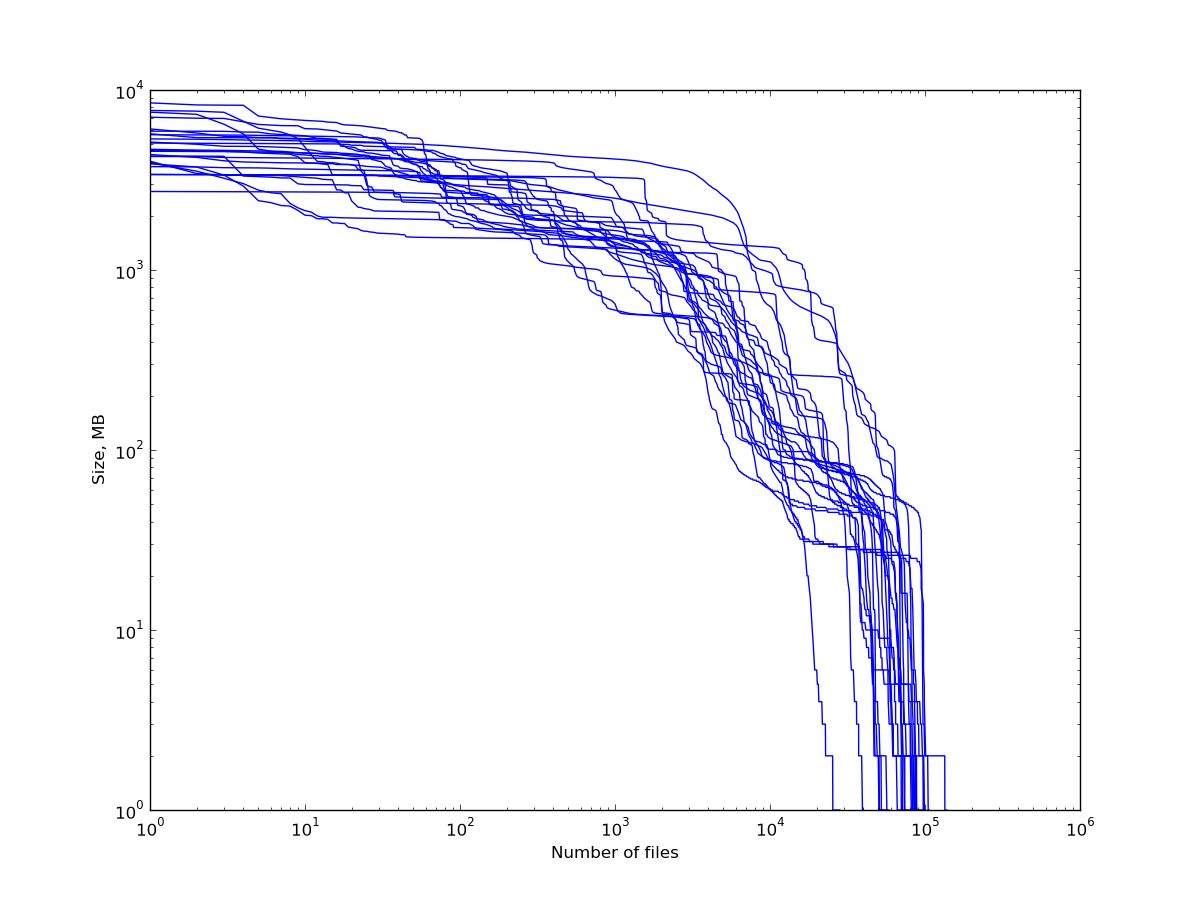
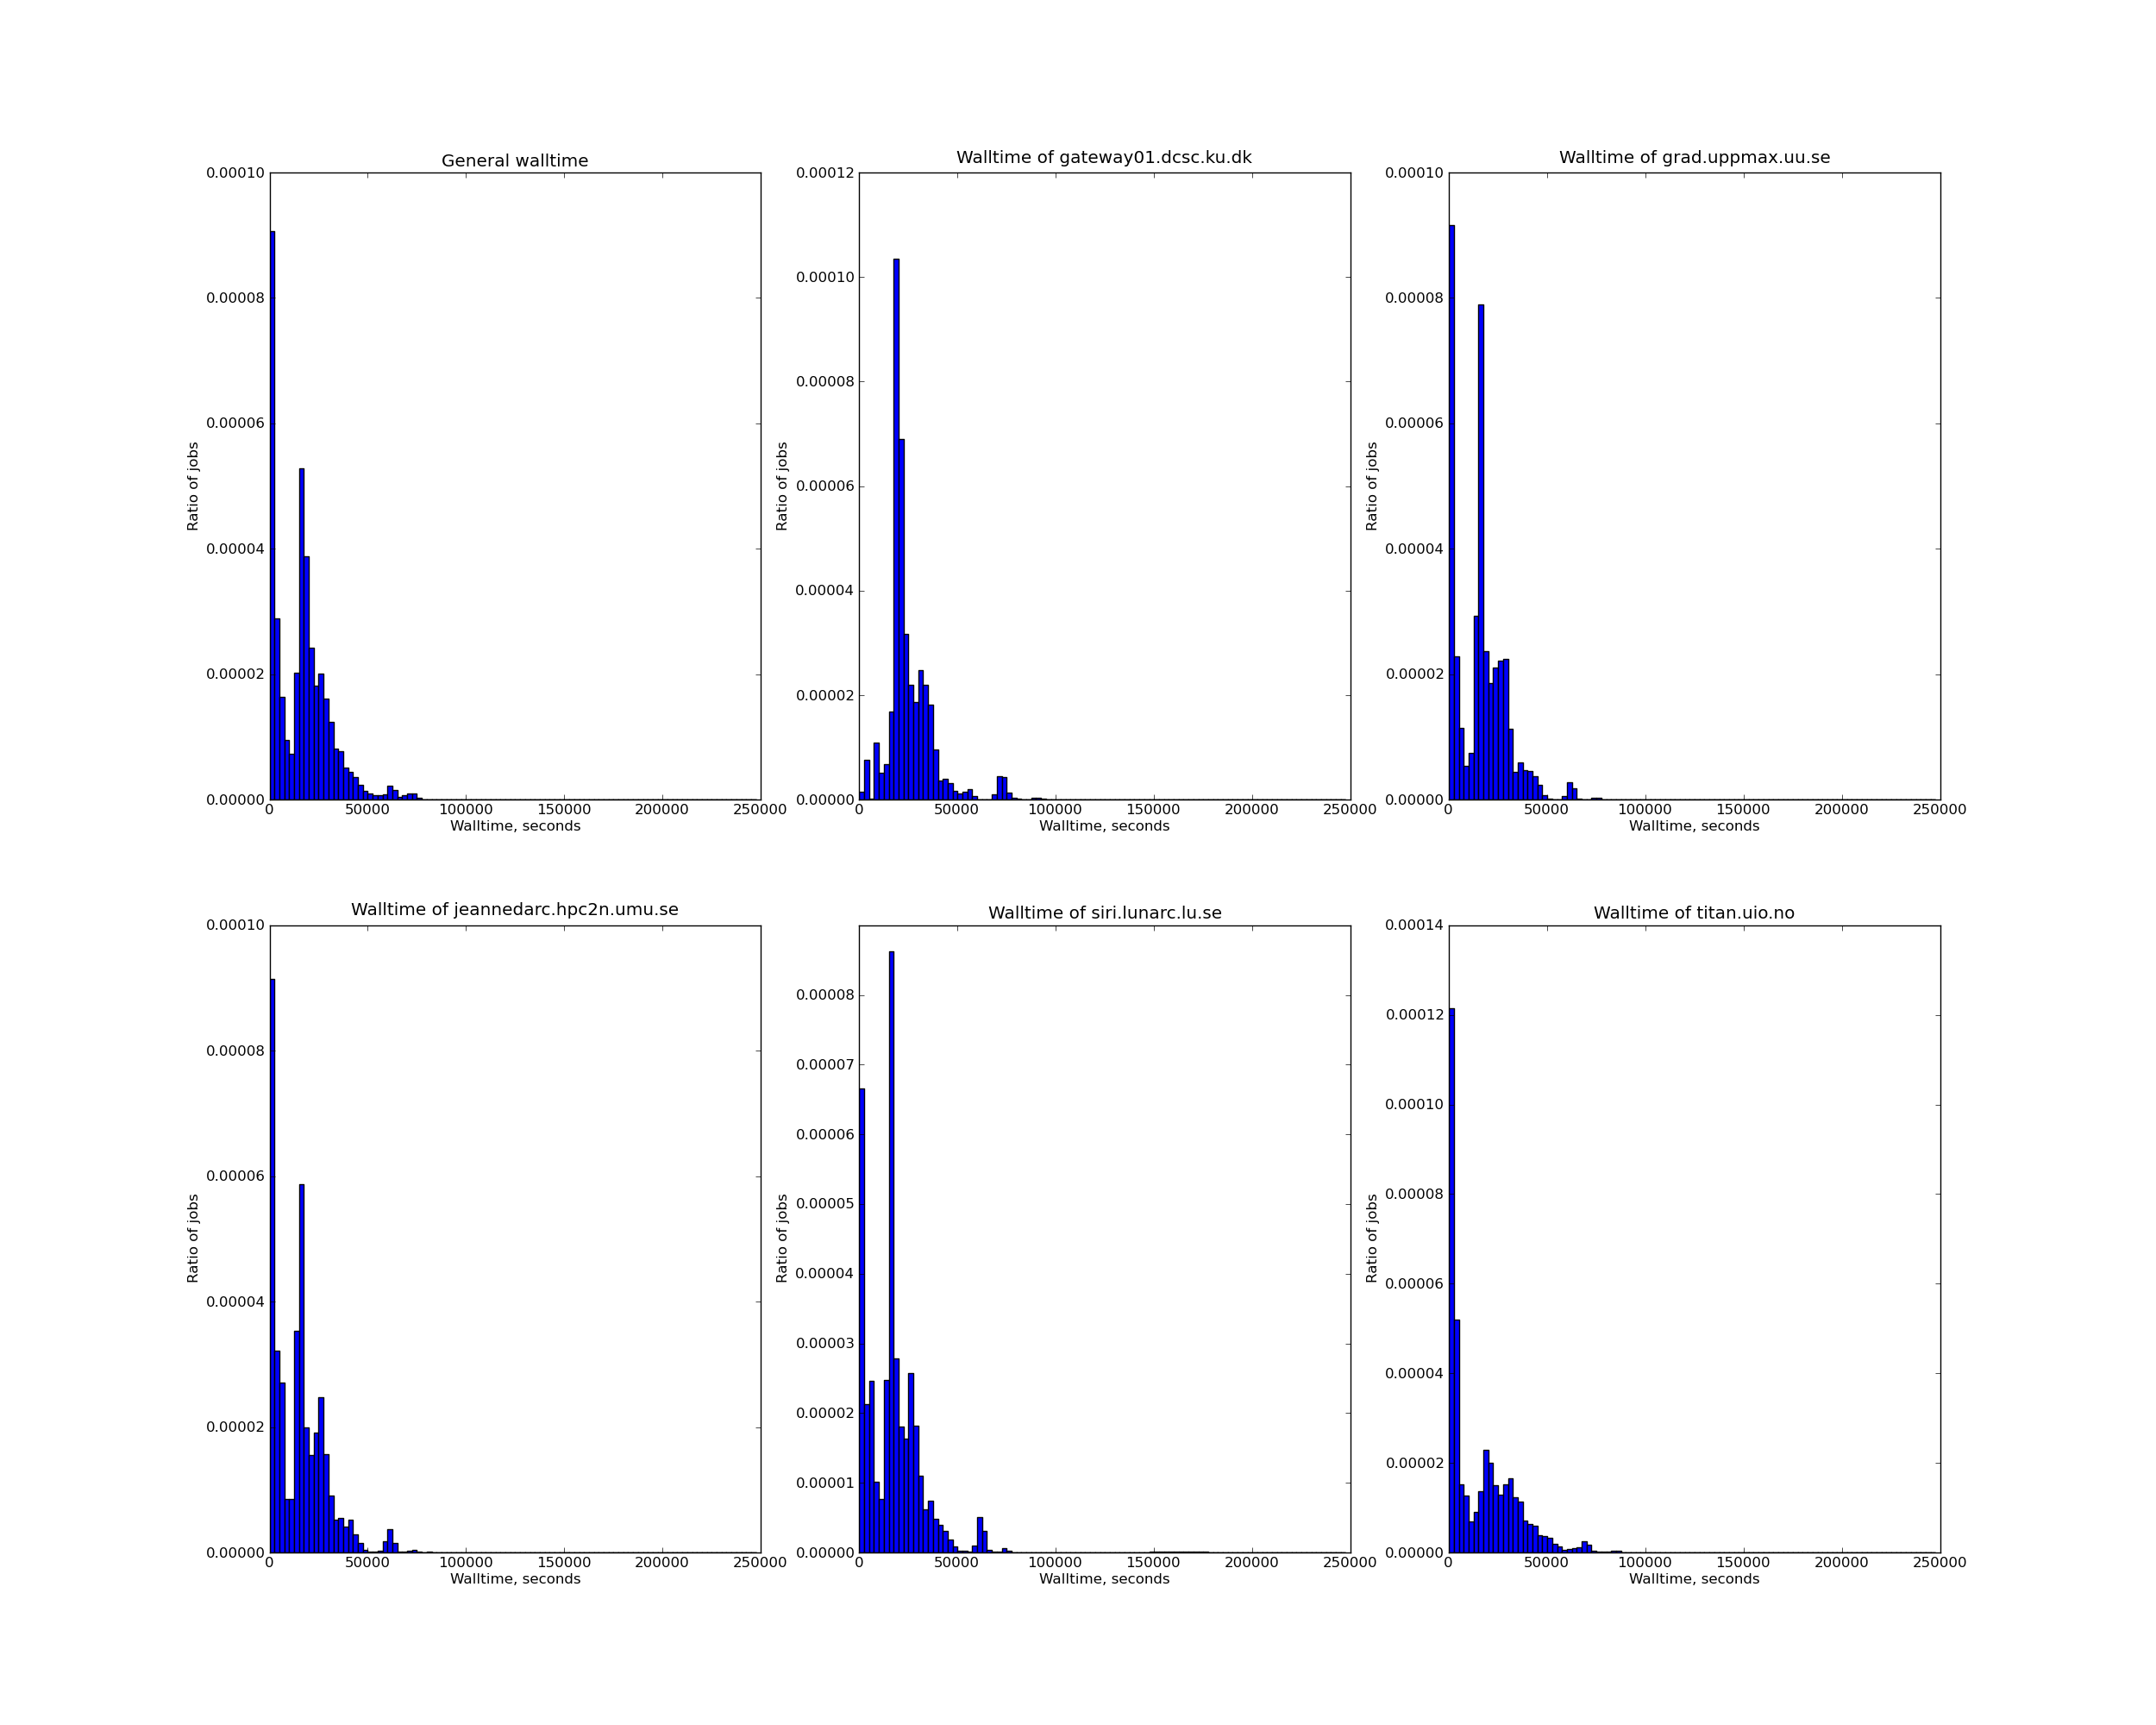
The plots that depict analyzed parameters per each week of the collected workflow. These plots confirm, that the parameters of the workflow are stable, and thus our 6-month sample is fully representative. The plots have logarithmic scale for better readability. A few jobs that have extreme values of parameters were removed from some of the plots, also for better readability.
- Input files per job (few jobs with 100+ files removed)
- Output files per job (few jobs with 20+ files removed)
- Input size per job
- Output size per job
- Walltimes of jobs
- Size of input files
- Size of output files
- Comparative histogram of walltimes for 5 clusters with most of jobs
Other statistics
These plots illustrate various things that were difficult to put in other categories.
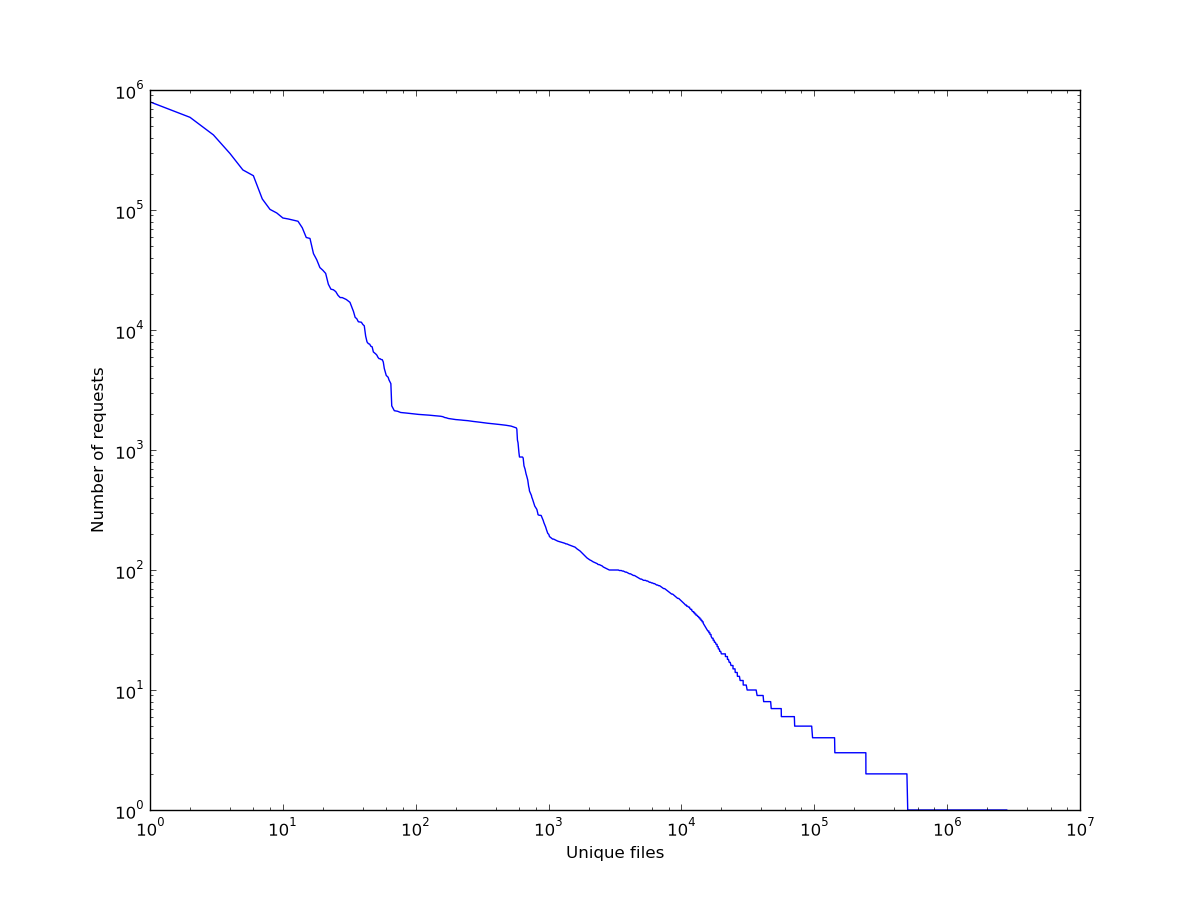
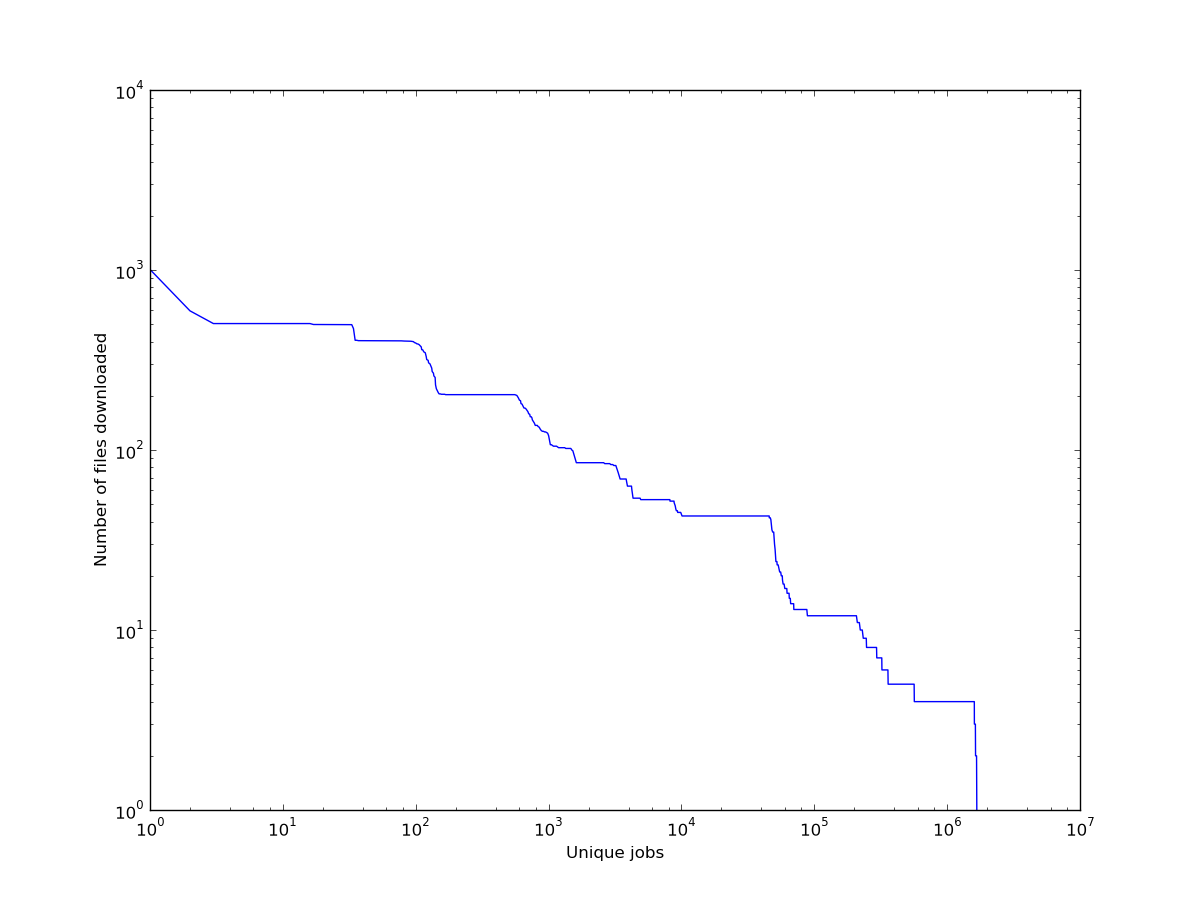
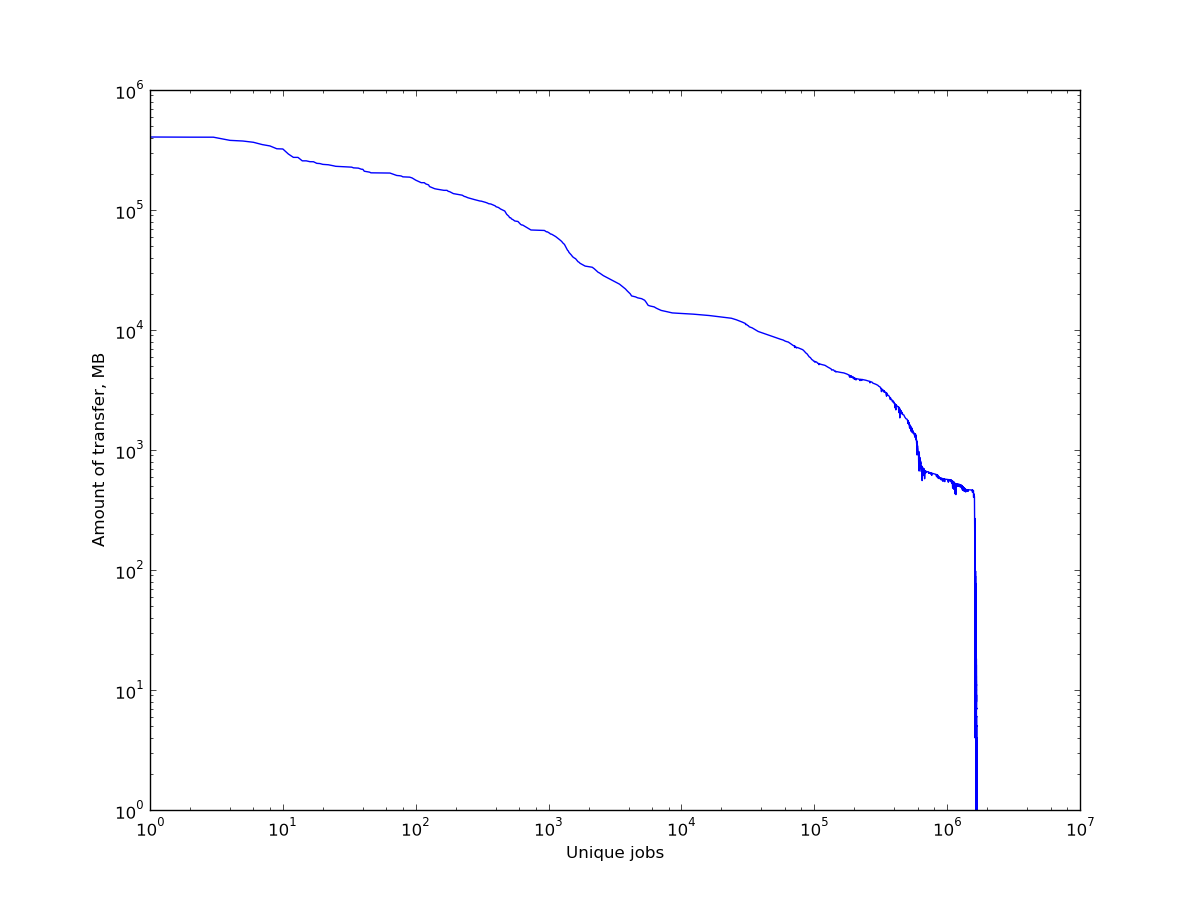
- Line plot of popularity of the unique input files on log scale
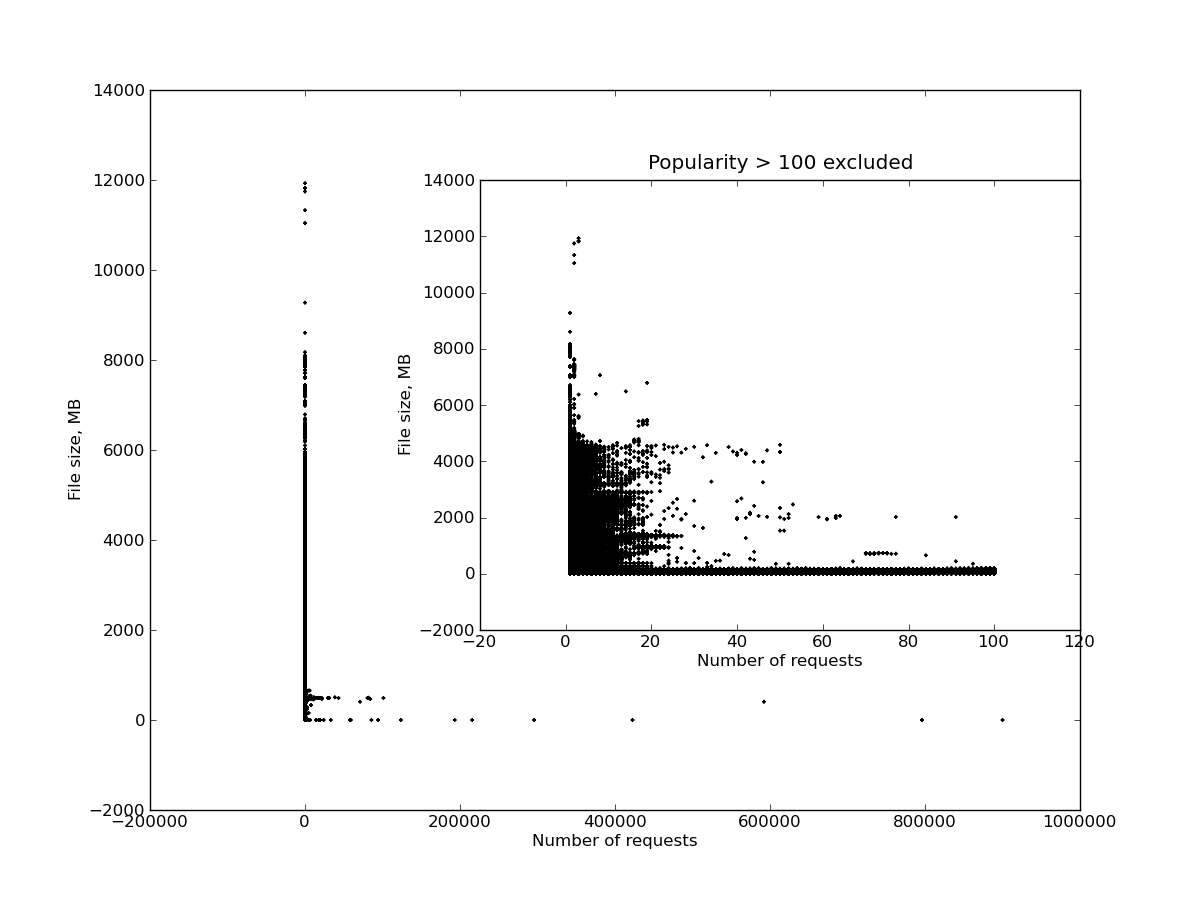
- Correlation between input files popularity and size
- Line plot of input requests per jobs on log scale
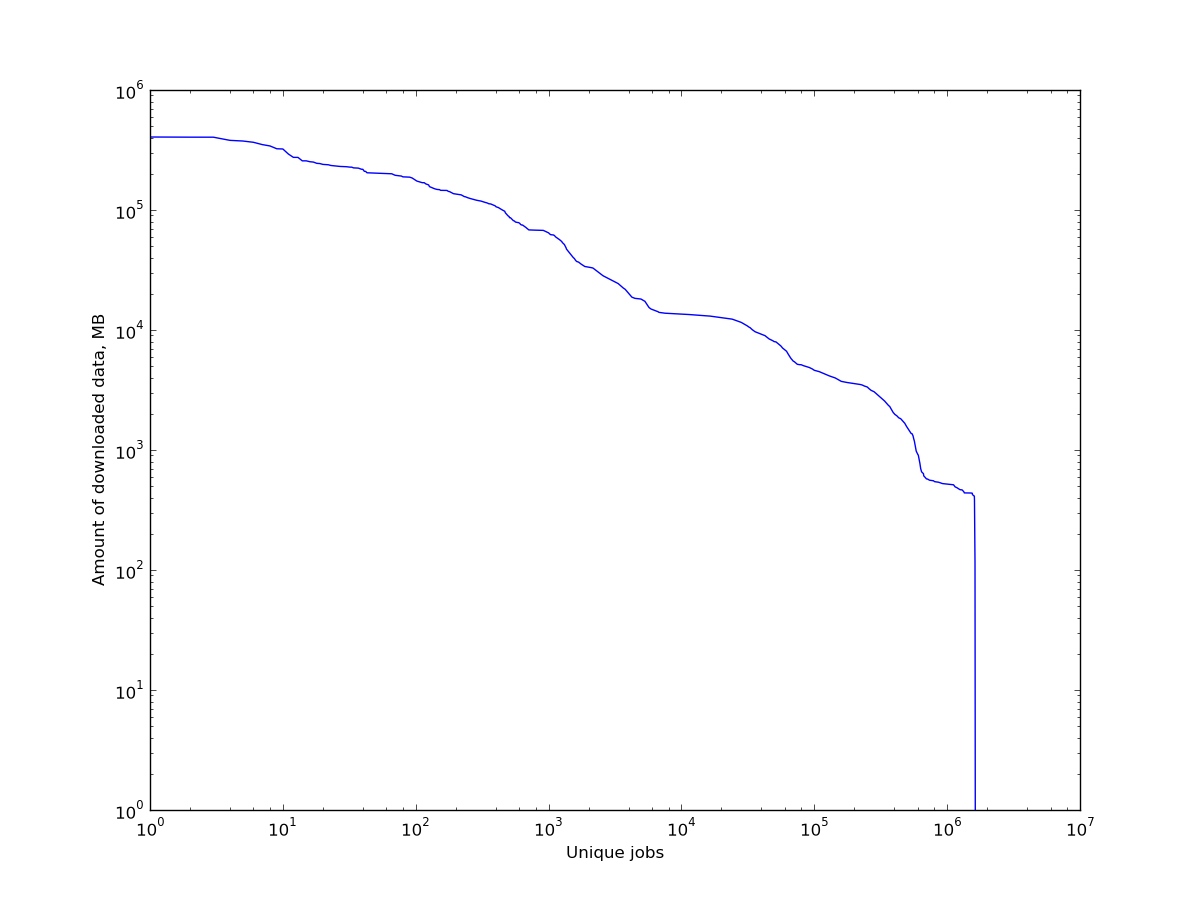
- Line plot of size of input per job on log scale
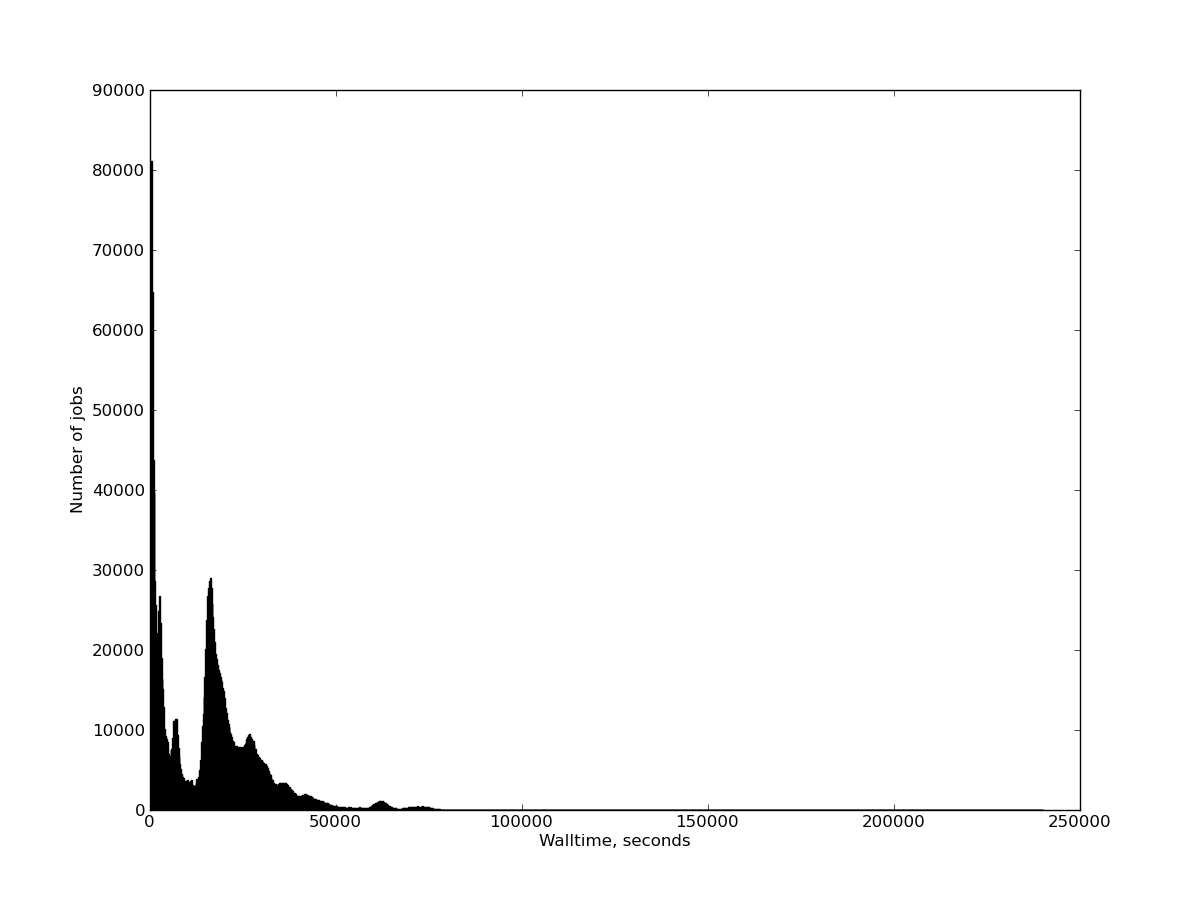
- Histogram of walltimes
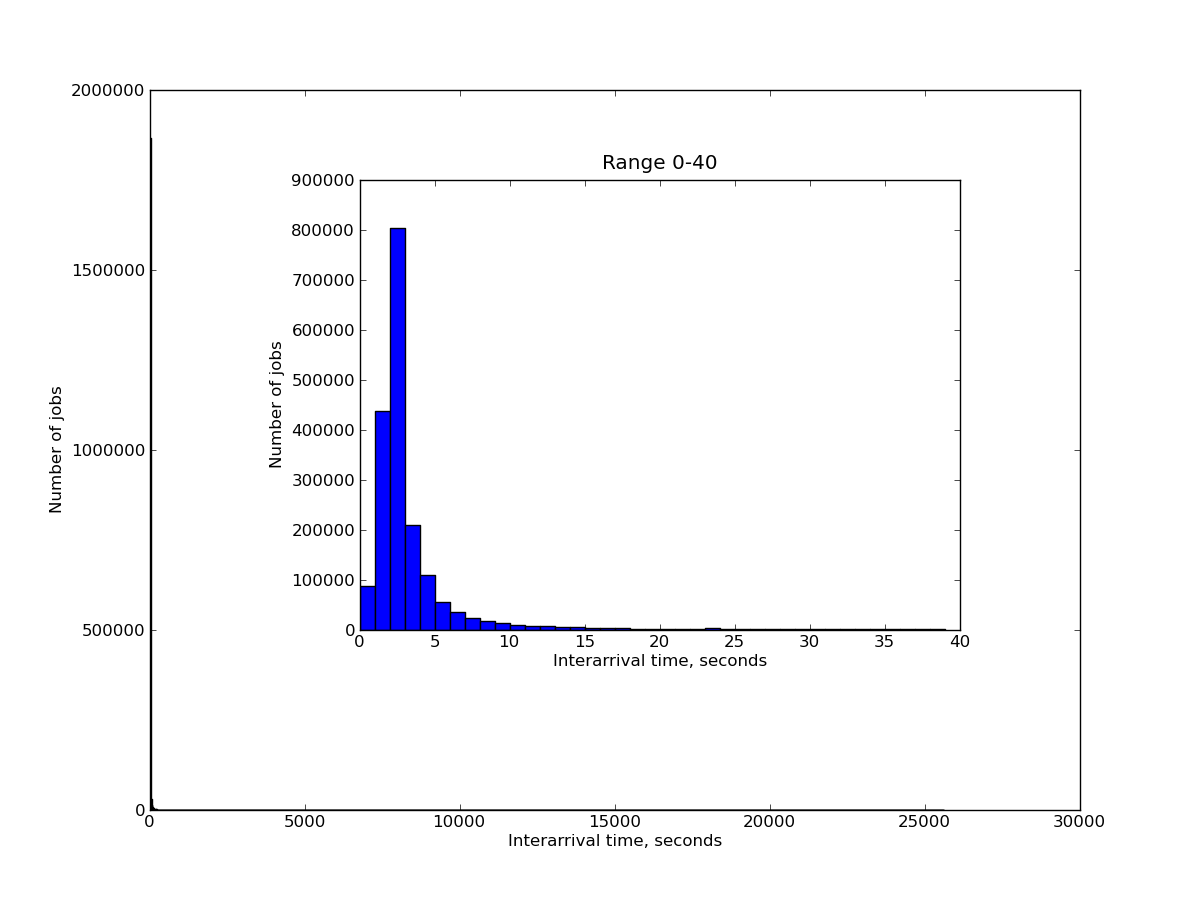
- Histogram of interarrival times
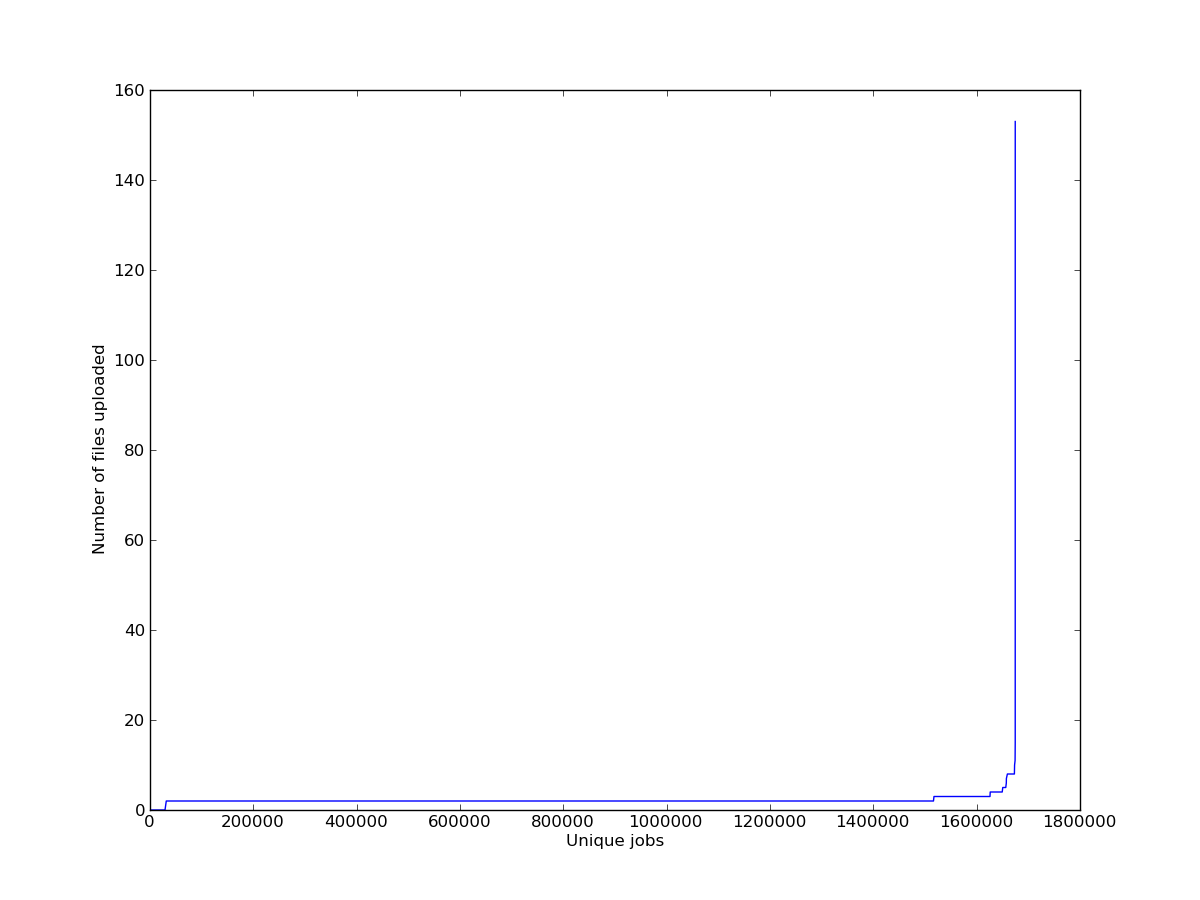
- Line plot of upload requests per jobs
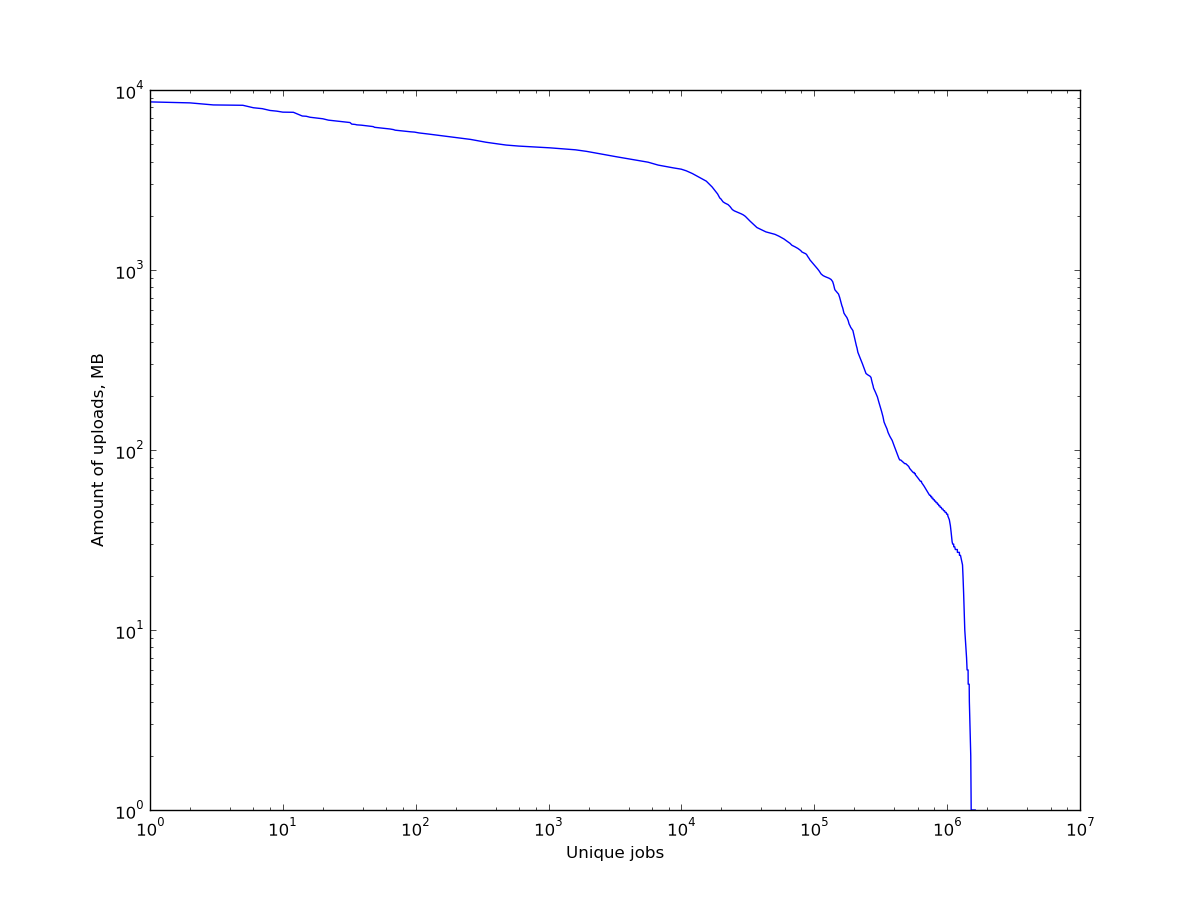
- Line plot of size of upload per jobs on log scale
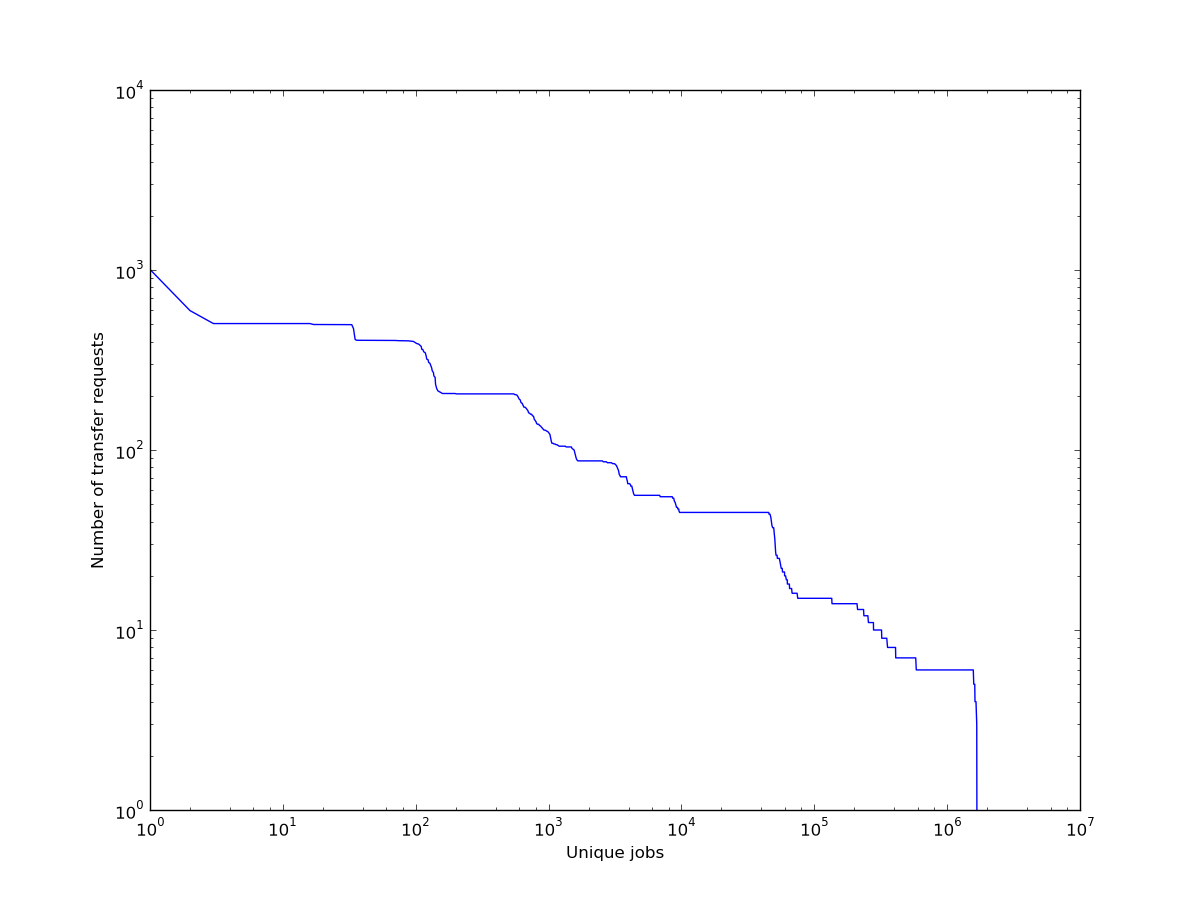
- Line plot of number of total transfer requests per jobs on log scale
- Line plot of total transfer size per jobs on log scale
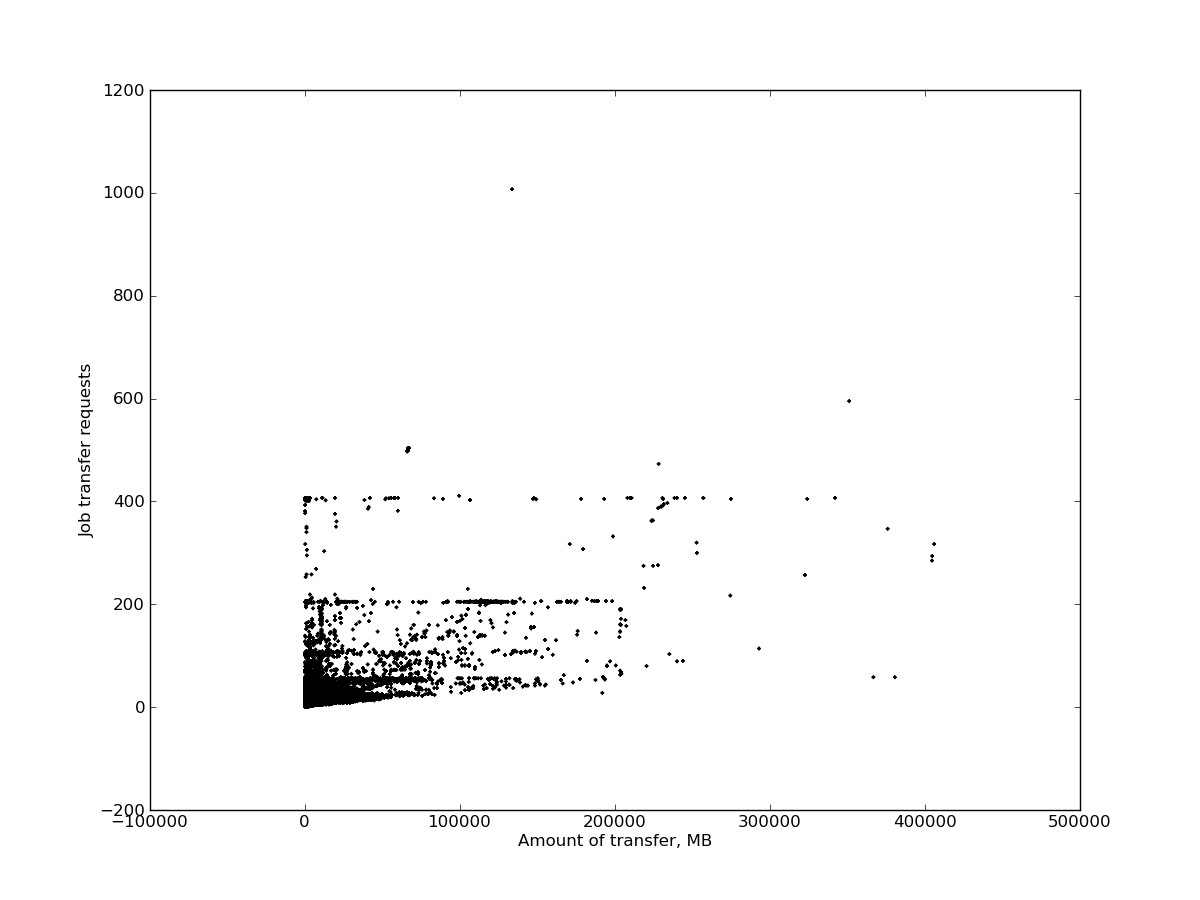
- Correlation between total number of requests and total size of transfer per job
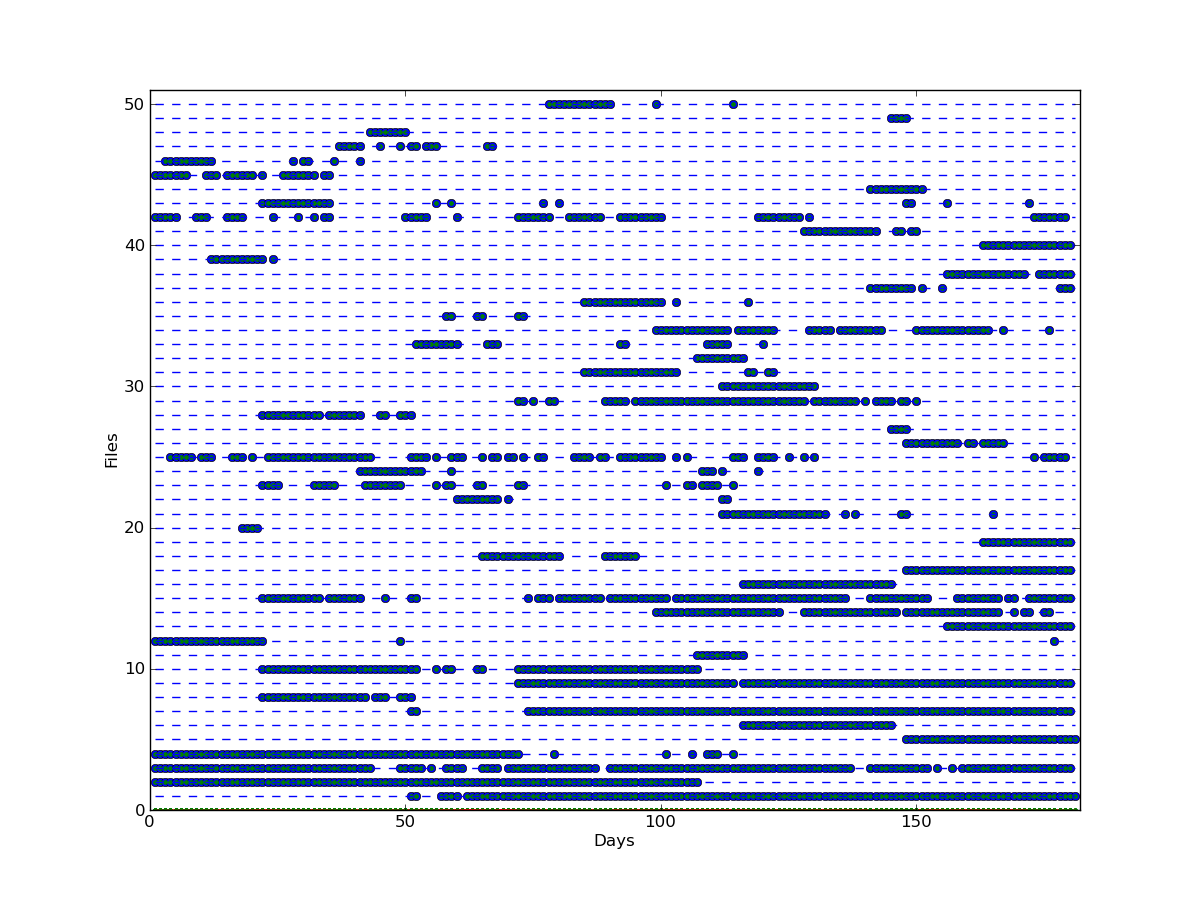
- The time span of requests for 50 most popular files